

Question: Find three major differences on the Income Statement between the competitor firms using IFRS ( Wipro) and GAAP (genpact) Note if they are recognition ,
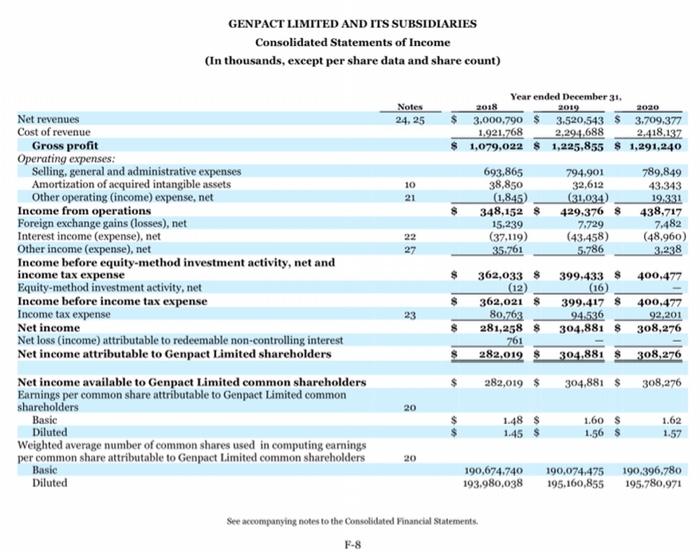
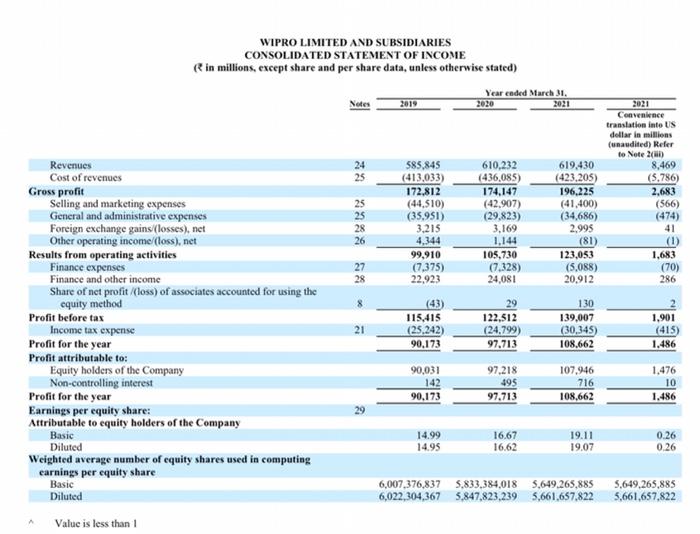
GENPACT LIMITED AND ITS SUBSIDIARIES Consolidated Statements of Income (In thousands, except per share data and share count) 2019 Notes 24, 25 10 21 Year ended December 31. 2018 2020 3.000,790 $ 3,520,543 $ 3.709.377 1.921.768 2,294,688 2.418.132 $ 1,079,022 $1,225,855 $ 1,291,240 693.865 794.901 789,849 38,850 32,612 43.343 (1,845) (31,034) 19.331 348,152 $ 429,376 8 438,717 15.239 7.729 7.482 (37.119) (43,458) (48,960) 35.761 3.338 362,033 % 399.4338 400.477 (12) (16) 362,021 $ 399.417 $ 400.477 80.263 94.536 92,201 281,258 $ 304.881 $ 308,276 761 282,019 $ 304,881 308,276 22 27 5-786 Net revenues Cost of revenue Gross profit Operating expenses: Selling, general and administrative expenses Amortization of acquired intangible assets Other operating (income) expense, net Income from operations Foreign exchange gains (losses), net Interest income (expense), net Other income (expense), net Income before equity-method investment activity, net and income tax expense Equity-method investment activity, net Income before income tax expense Income tax expense Net income Net loss (income) attributable to redeemable non-controlling interest Net income attributable to Genpact Limited shareholders Net income available to Genpact Limited common shareholders Earnings per common share attributable to Genpact Limited common shareholders Basic Diluted Weighted average number of common shares used in computing earnings per common share attributable to Genpact Limited common shareholders Basic Diluted $ 23 282,019 $ 304,881 $ 308,276 20 1.62 1.48 $ 1.45$ 1.60 $ 1.56 $ 1.57 20 190,674.740 193,980,038 190,074475190.396.780 195,160,855 195.780,971 See accompanying notes to the Consolidated Financial Statements. F-8 WIPRO LIMITED AND SUBSIDIARIES CONSOLIDATED STATEMENT OF INCOME in millions, except share and per share data, unless otherwise stated) Year ended March 31. 2021 Notes 2020 24 25 585,845 (413.033) 172.812 (44.510) (35,951) 3.215 4,344 99,910 (7.375) 22,923 25 25 28 26 610,232 (436,085) 174,147 (42,907) (29,823) 3.169 1.144 105,730 (7.328) 24,081 2021 Convenience translation into US dollar in millions (unaudited) Refer to Note 2 8,469 (5.786) 2.683 (566) (474) 41 (1) 1,683 (70) 286 619.430 (423.205) 196.225 (41,400) (34,686) 2,995 (81) 123,053 (5.088) 20,912 27 28 21 Revenues Cost of revenues Gross profit Selling and marketing expenses General and administrative expenses Foreign exchange gains (losses), net Other operating income/(loss), net Results from operating activities Finance expenses Finance and other income Share of net profit (loss) of associates accounted for using the equity method Profit before tax Income tax expense Profit for the year Profit attributable to: Equity holders of the Company Non-controlling interest Profit for the year Earnings per equity share: Attributable to equity holders of the Company Basic Diluted Weighted average number of equity shares used in computing earnings per equity share Basic Diluted Value is less than 1 115,415 (25.242) 90,173 29 122,512 (24.799) 97.713 130 139,007 (30,345) 108,662 1,901 (415) 1.486 90,031 142 90.173 97,218 495 97.713 107,946 716 108,662 1.476 10 1.486 29 14.99 14.95 16.67 16.62 19.11 19.07 0.26 0.26 6,007,376,837 5.833.384,018 5,649,265,885 6,022,304,367 5.847,823,239 5,661,657,822 5,649,265,885 5,661,657,822
Step by Step Solution
There are 3 Steps involved in it

Get step-by-step solutions from verified subject matter experts