

Question: @& Finder File Edit Go Window Help Sat Mar 23 2:35PM @ ng.cengage.com Richard '..Q CENGAGE ' MINDTAP Q Search this course Module Three Quiz
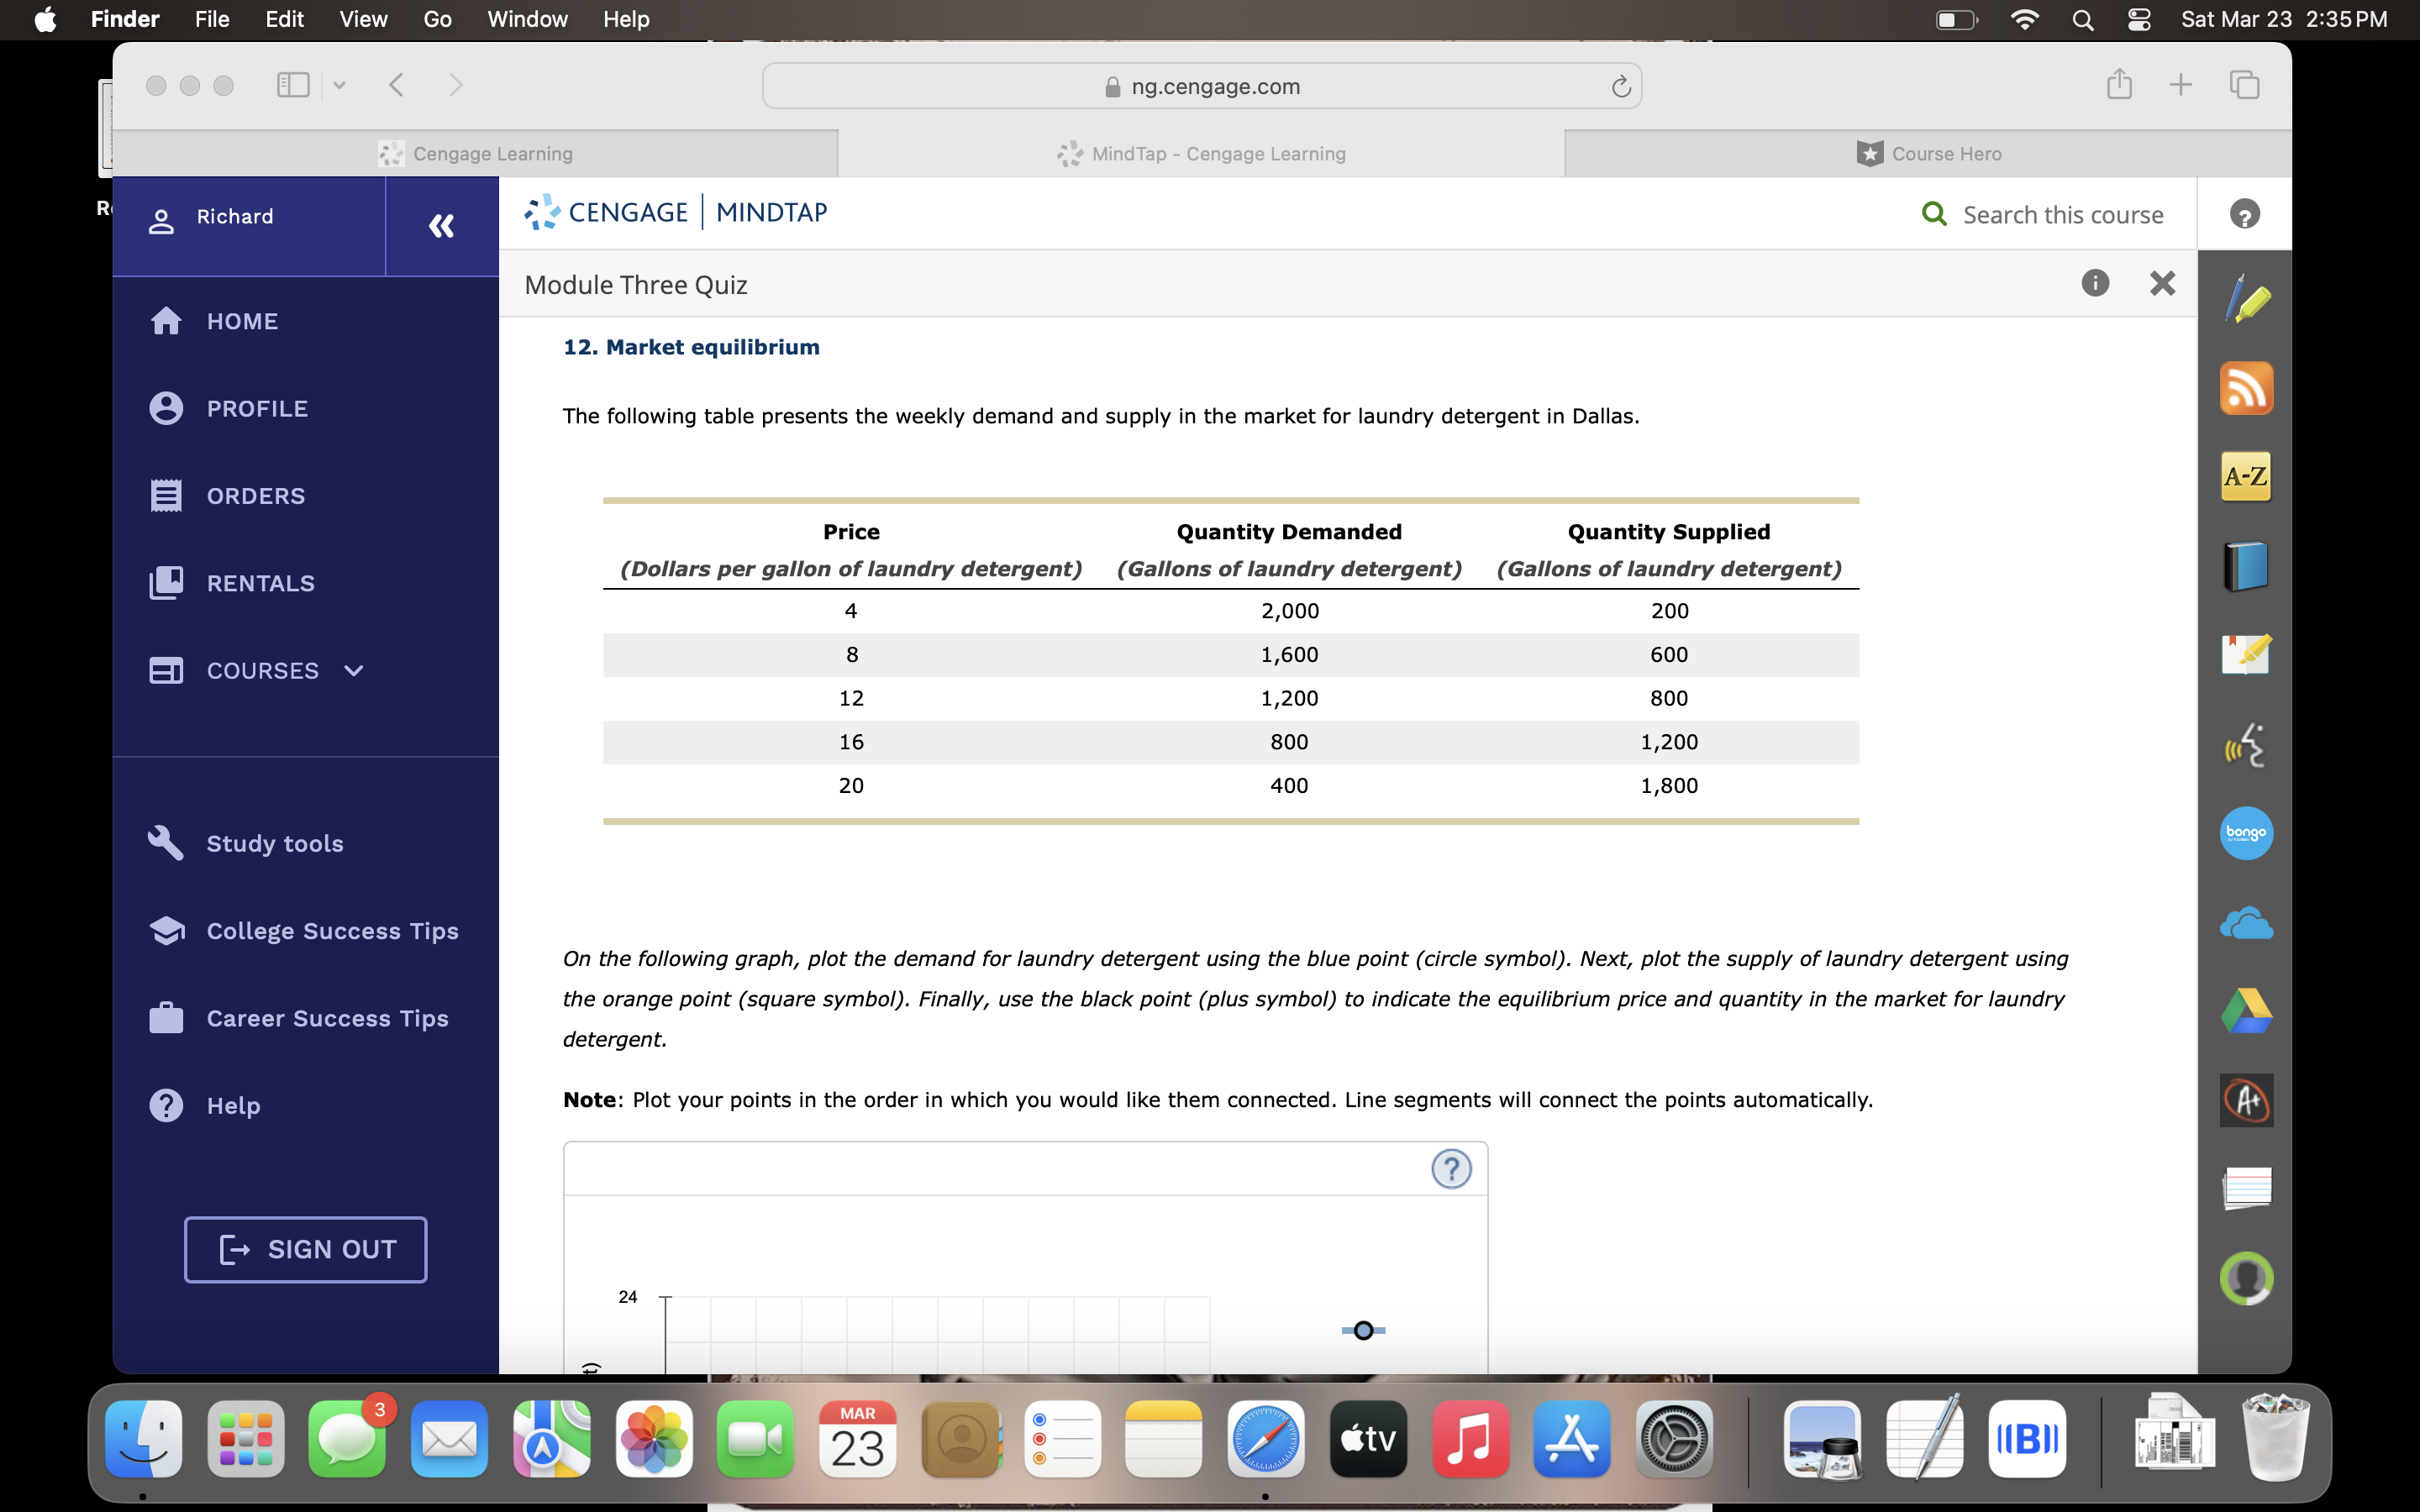
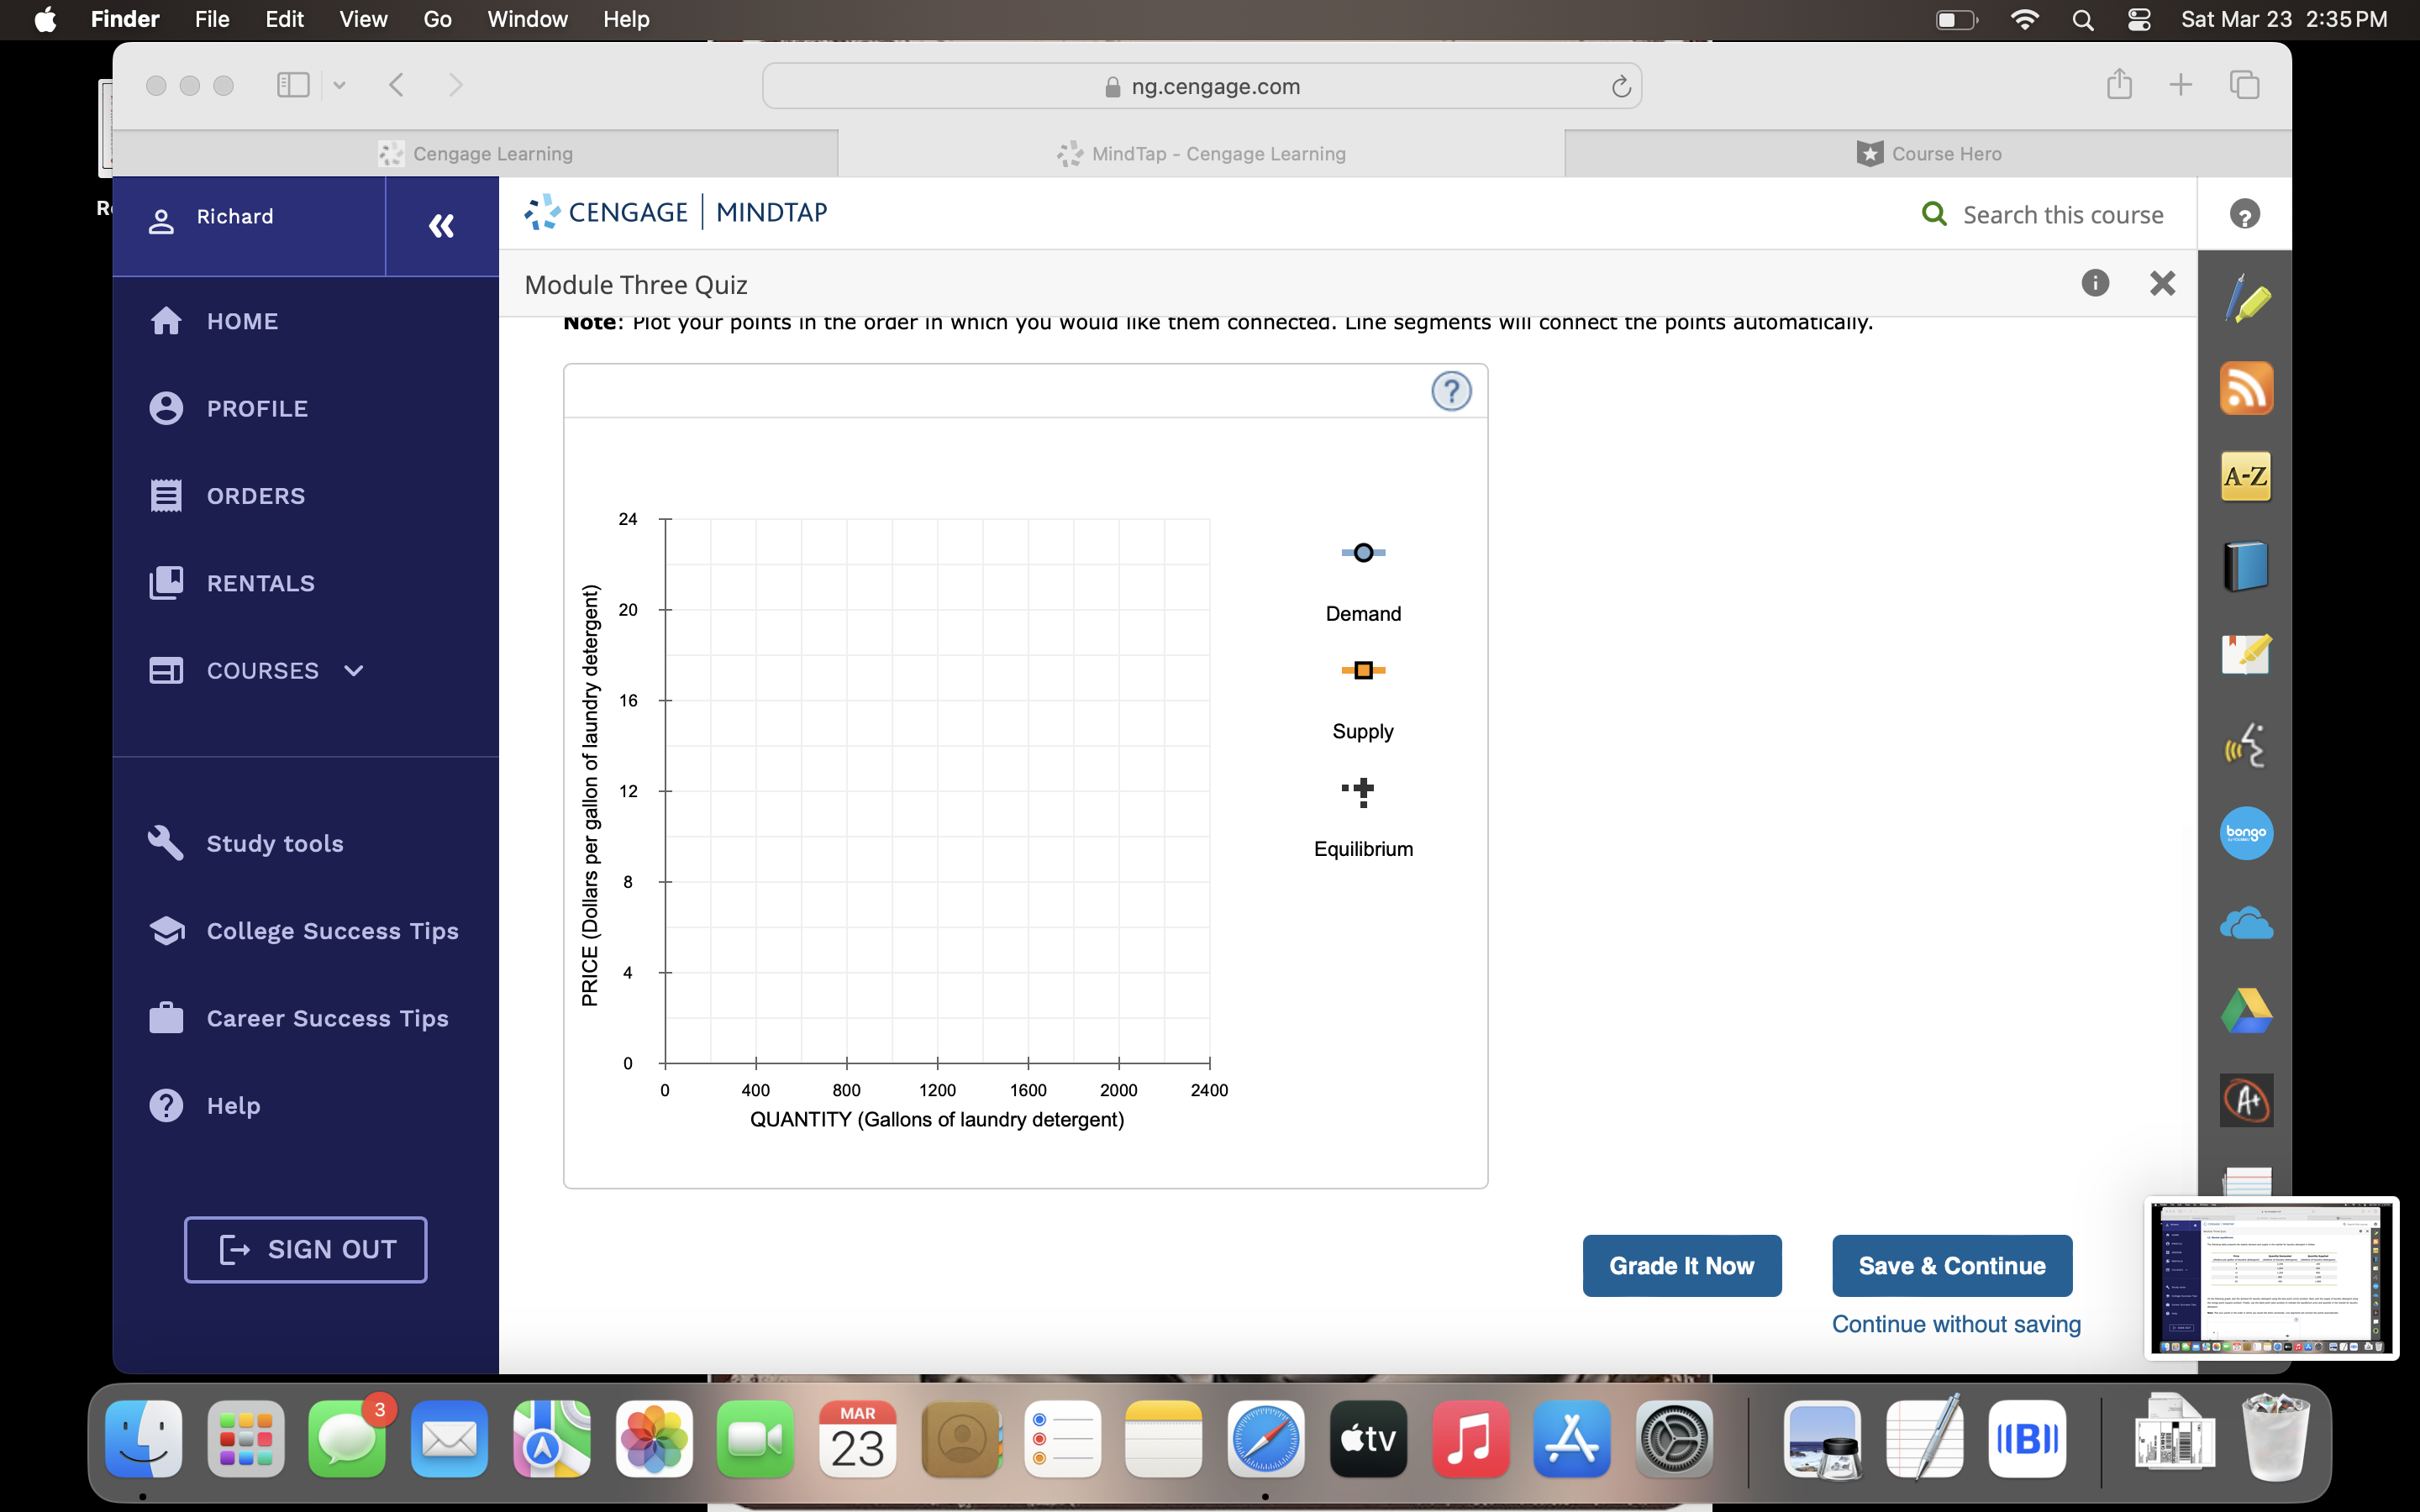
@& Finder File Edit Go Window Help Sat Mar 23 2:35PM @ ng.cengage.com Richard '..Q CENGAGE ' MINDTAP Q Search this course Module Three Quiz @ X 12. Market equilibrium Lol N S The following table presents the weekly demand and supply in the market for laundry detergent in Dallas. ORDERS Price Quantity Demanded Quantity Supplied (Dollars per gallon of laundry detergent) (Gallons of laundry detergent) (Gallons of laundry detergent) 4 2,000 200 RENTALS COURSES v 8 1,600 600 12 1,200 800 16 800 1,200 20 400 1,800 Study tools College Success Tips On the following graph, plot the demand for laundry detergent using the blue point (circle symbol). Next, plot the supply of laundry detergent using the orange point (square symbol). Finally, use the black point (plus symbol) to indicate the equilibrium price and quantity in the market for laundry Career Success Tips detergent. 0 Help Note: Plot your points in the order in which you would like them connected. Line segments will connect the points automatically. @\\ L | i [c]\\o) Finder File Edit View Go Window Help Q Sat Mar 23 2:35 PM
Step by Step Solution
There are 3 Steps involved in it

Get step-by-step solutions from verified subject matter experts