

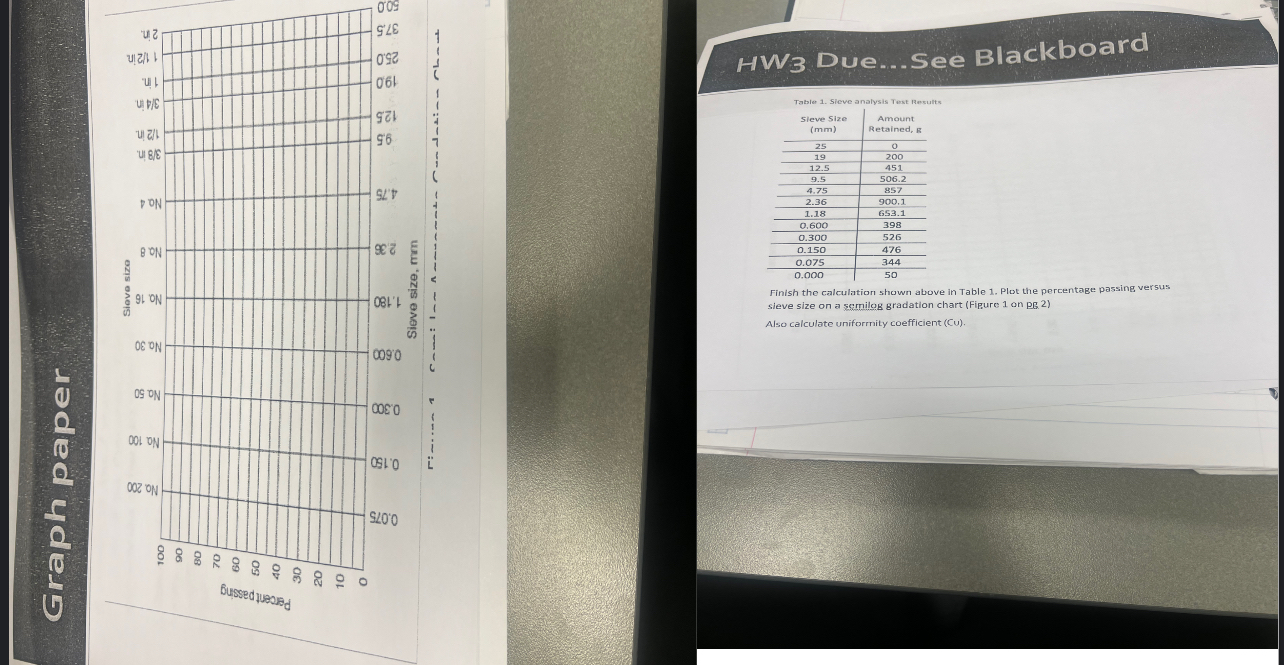
Question: Finish the calculation shown above in Table 1 . Plot the percentage passing versus sieve size on a semilog gradation chart ( Figure 1 on
Finish the calculation shown above in Table Plot the percentage passing versus sieve size on a semilog gradation chart Figure on Also calculate uniformity coefficient CU
Step by Step Solution
There are 3 Steps involved in it
1 Expert Approved Answer
Step: 1 Unlock

Question Has Been Solved by an Expert!
Get step-by-step solutions from verified subject matter experts
Step: 2 Unlock
Step: 3 Unlock