

Question: First Blank: IRR,MIRR,Payback Second: IRR,MIRR,Payback Third: Steep, Flat Fourth: Decline, Rise Fifth: Less, Greater Sixth: Less, Greater Seventh: IRR,MIRR,Payback,NPV A project's NPV profile graph intersects
First Blank: IRR,MIRR,Payback
Second: IRR,MIRR,Payback
Third: Steep, Flat
Fourth: Decline, Rise
Fifth: Less, Greater
Sixth: Less, Greater
Seventh: IRR,MIRR,Payback,NPV
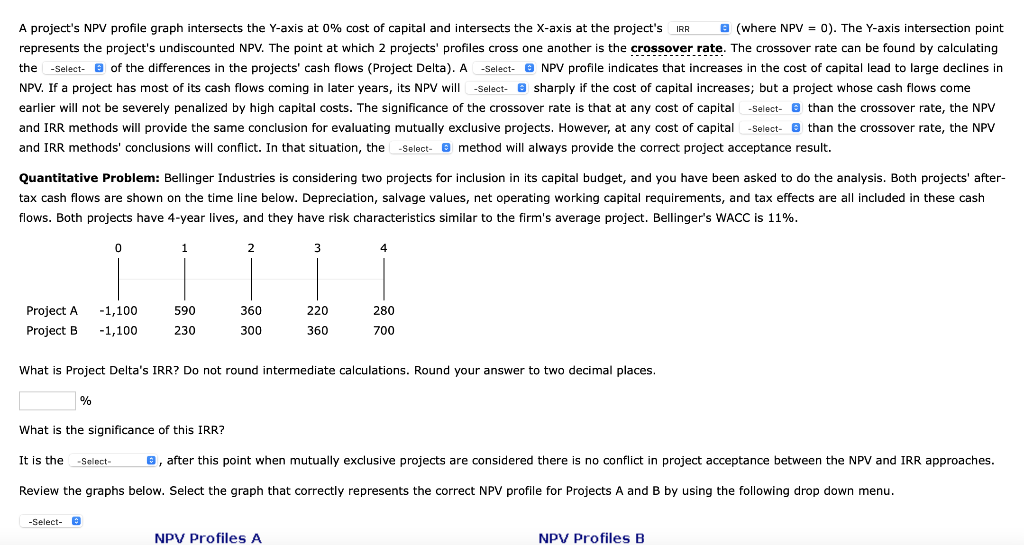
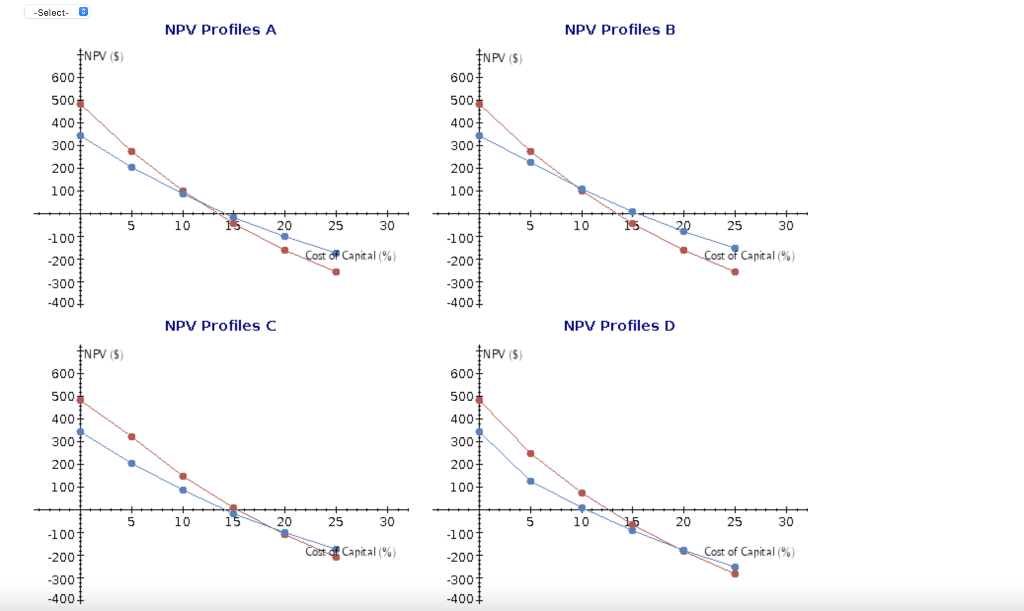
A project's NPV profile graph intersects the Y-axis at 0% cost of capital and intersects the X-axis at the project's IRR B (where NPV = 0). The Y-axis intersection point represents the project's undiscounted NPV. The point at which 2 projects' profiles cross one another is the crossover rate. The crossover rate can be found by calculating the -Select- of the differences in the projects' cash flows (Project Delta). A -Select- NPV profile indicates that increases in the cost of capital lead to large declines in NPV. If a project has most of its cash flows coming in later years, its NPV will -Select- sharply if the cost of capital increases; but a project whose cash flows come earlier will not be severely penalized by high capital costs. The significance of the crossover rate is that at any cost of capital -Select- @than the crossover rate, the NPV and IRR methods will provide the same conclusion for evaluating mutually exclusive projects. However, at any cost of capital -Select- than the crossover rate, the NPV and IRR methods' conclusions will conflict. In that situation, the -Select- method will always provide the correct project acceptance result. Quantitative Problem: Bellinger Industries is considering two projects for inclusion in its capital budget, and you have been asked to do the analysis. Both projects' after- tax cash flows are shown on the time line below. Depreciation, salvage values, net operating working capital requirements, and tax effects are all included in these cash flows. Both projects have 4-year lives, and they have risk characteristics similar to the firm's average project. Bellinger's WACC is 11%. 0 2 3 Project A 220 280 -1,100 -1,100 590 230 360 300 Project B 360 700 What is Project Delta's IRR? Do not round intermediate calculations. Round your answer to two decimal places. % What is the significance of this IRR? It is the Select @, after this point when mutually exclusive projects are considered there is no conflict in project acceptance between the NPV and IRR approaches. Review the graphs below. Select the graph that correctly represents the correct NPV profile for Projects A and B by using the following drop down menu. -Select- NPV Profiles A NPV Profiles B -Select- NPV Profiles A NPV Profiles B INPV (5 INPV (5) 600 500+ 400 300 600 500 400+ 300 2001 200 100 100 10 20 25 30 5 10 25 30 Cost of Capital% Cost of Capital %) -100 -200 -300 -4001 -100 -200 -3001 -4001 NPV Profiles C NPV Profiles D INPV (5) INPV (5) 600 5001 400+ 300 200 600 500+ 4001 300+ 2001 100 1007 5 10 20 25 30 5 10 20 25 30 Cost of Capital% Cost of Capital (%) -100 -200 -300 -4001 -1001 -200 -300 -4001
Step by Step Solution
There are 3 Steps involved in it

Get step-by-step solutions from verified subject matter experts