

Question: First Comment: You make your first comment before seeing any other. This is the most important comment in determining your grade. In one to three
First Comment: You make your first comment before seeing any other. This is the most important comment in determining your grade. In one to three sentences characterize the company by listing its strengths. You can cite between one and three strengths. Support each strength by at least one fact. The facts you cite can be either from the narrative or the spreadsheet. In one to three sentences refer to concerns you might have about the company. You can cite between one and three concerns. Support each concern by at least one fact. The facts you cite can be from either the narrative or the spreadsheet. Finally, state whether you would recommend that the loan be granted or you would reject the loan application. Support you decision by one to three facts. These facts should be number-crunching facts (from the spreadsheets)
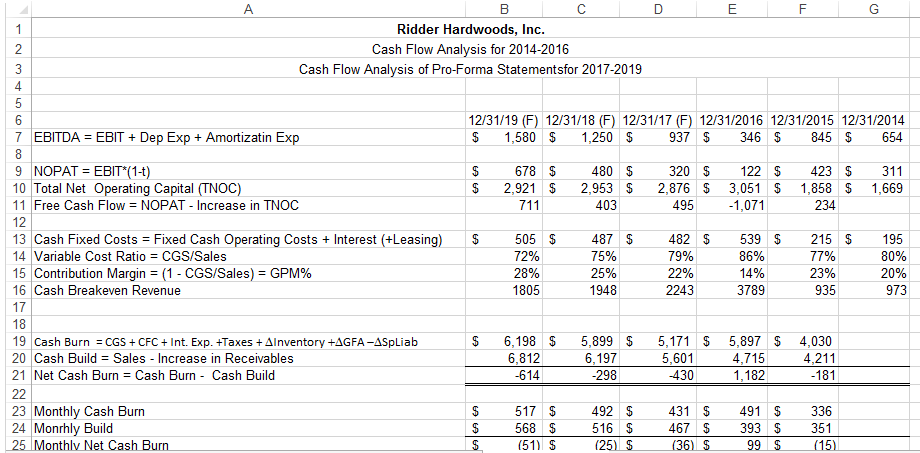
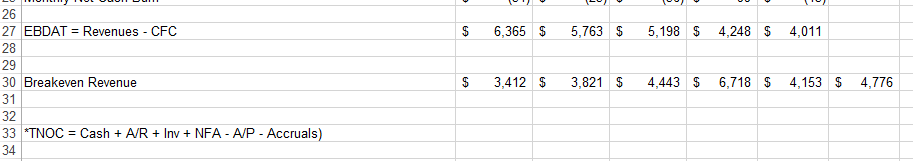
Ridder Hardwoods, Inc Cash Flow Analysis for 2014-2016 Cash Flow Analysis of Pro-For a State 2017-2019 12/31/19 (F) 12/31/18 (F) 12/31/17 (F) 12/31/2016 12/31/2015 12/31/2014 1,580 1,250 937 346 845 654 7 EBITDA EBIT Dep Exp Amortizatin Exp 678 480 320 122 423 311 9 NOPAT EBIT (1-t) 2,921 2,953 2,876 3,051 1,858 1,669 10 Total Net Operating Capital (TNOC) 711 403 495 -1,071 234 11 Free Cash Flow NOPAT Increase in TNOC 12 13 Cash Fixed Costs Fixed Cash Operating Costs nterest (+Leasing 505 487 482 539 215 195 79% 86% 77% 80% 72% 14 Variable Cost Ratio CGS/Sales 75% 23% 15 Contribution Margin 1 CGS/Sales GPM%. 28% 25% 22% 14% 20% 16 Cash Breakeven Revenue 1948 2243 935 1805 3789 973 17 18 6,198 5,899 5,171 5,897 4,030 19 Cash Burn CGS CFC Int. Exp. +Taxes +Alnventory +AGFA-ASpLiab 6812 6.19 20 Cash Build Sales ncrease in Receivables 5,601 4,715 4,211 -614 -298 -430 1,182 181 21 Net Cash Burn Cash Burn ash Build 517 492 431 491 336 23 Month y Cash Burn 516 S 467 393 351 24 Monrhly Build 568 Monthly Net cash Burn (51) S (25 S (36) 99 (15) 25 Ridder Hardwoods, Inc Cash Flow Analysis for 2014-2016 Cash Flow Analysis of Pro-For a State 2017-2019 12/31/19 (F) 12/31/18 (F) 12/31/17 (F) 12/31/2016 12/31/2015 12/31/2014 1,580 1,250 937 346 845 654 7 EBITDA EBIT Dep Exp Amortizatin Exp 678 480 320 122 423 311 9 NOPAT EBIT (1-t) 2,921 2,953 2,876 3,051 1,858 1,669 10 Total Net Operating Capital (TNOC) 711 403 495 -1,071 234 11 Free Cash Flow NOPAT Increase in TNOC 12 13 Cash Fixed Costs Fixed Cash Operating Costs nterest (+Leasing 505 487 482 539 215 195 79% 86% 77% 80% 72% 14 Variable Cost Ratio CGS/Sales 75% 23% 15 Contribution Margin 1 CGS/Sales GPM%. 28% 25% 22% 14% 20% 16 Cash Breakeven Revenue 1948 2243 935 1805 3789 973 17 18 6,198 5,899 5,171 5,897 4,030 19 Cash Burn CGS CFC Int. Exp. +Taxes +Alnventory +AGFA-ASpLiab 6812 6.19 20 Cash Build Sales ncrease in Receivables 5,601 4,715 4,211 -614 -298 -430 1,182 181 21 Net Cash Burn Cash Burn ash Build 517 492 431 491 336 23 Month y Cash Burn 516 S 467 393 351 24 Monrhly Build 568 Monthly Net cash Burn (51) S (25 S (36) 99 (15) 25
Step by Step Solution
There are 3 Steps involved in it

Get step-by-step solutions from verified subject matter experts