

Question: First, complete Table 6. Then use the answers from Table 6 to complete Table 1. Table 1 Proforma 1993 1994 1990 1991 1992 Assets: Cash
First, complete Table 6. Then use the answers from Table 6 to complete Table 1.
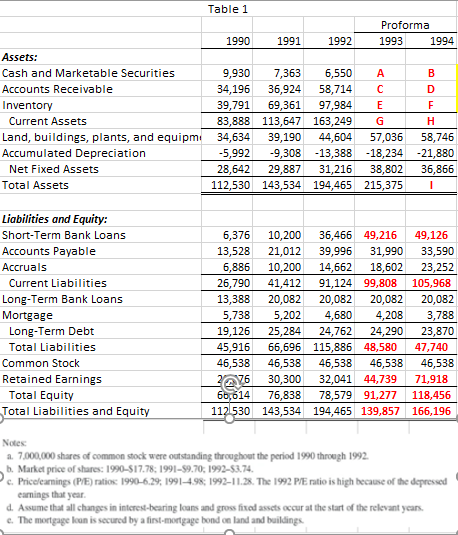
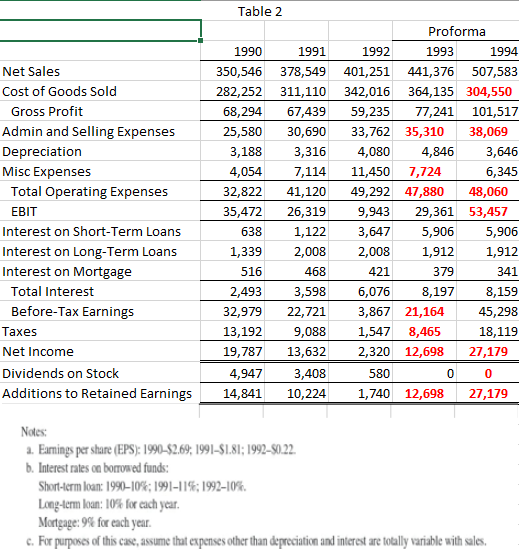
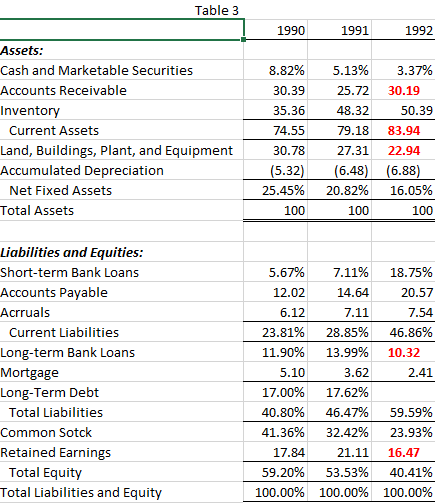
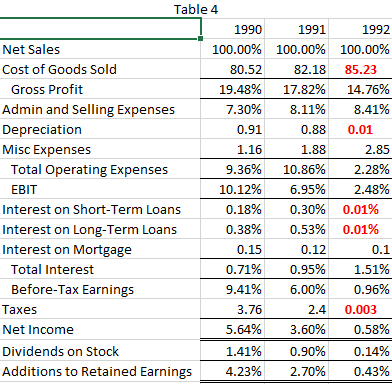
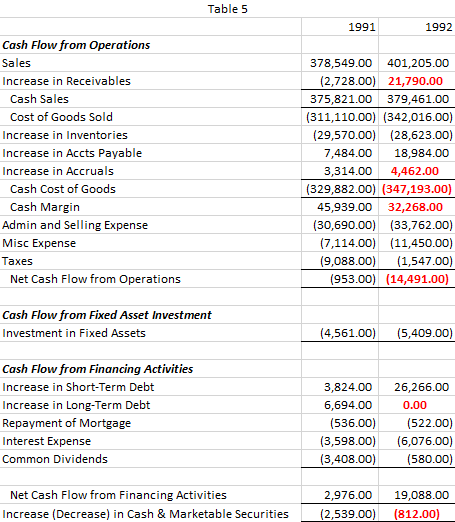
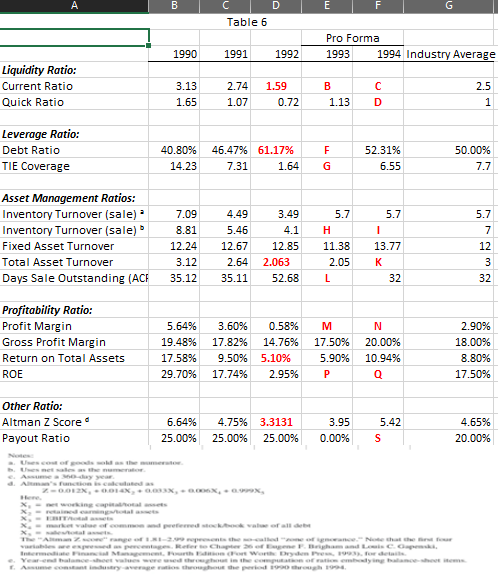
Table 1 Proforma 1993 1994 1990 1991 1992 Assets: Cash and Marketable Securities Accounts Receivable Inventory Current Assets Land, buildings, plants, and equipm Accumulated Depreciation Net Fixed Assets Total Assets 9,930 7,363 6,550 A B 34,196 36,924 58,714 C D 39,791 69,361 97,984 E F 83,888 113,647 163,249 G H 34,634 39,190 44,604 57,036 58,746 -5,992 -9,308 -13,388 -18,234 -21,880 28,642 29,887 31,216 38,802 36,866 112,530 143,534 194,465 215,375 1 Liabilities and Equity: Short-Term Bank Loans Accounts Payable Accruals Current Liabilities Long-Term Bank Loans Mortgage Long-Term Debt Total Liabilities Common Stock Retained Earnings Total Equity Total Liabilities and Equity 6,376 10,200 36,466 49,216 49,126 13,528 21,012 39,996 31,990 33,590 6,886 10,200 14,662 18,602 23,252 26,790 41,412 91,124 99,808 105,968 13,388 20,082 20,082 20,082 20,082 5,738 5,202 4,680 4,208 3,788 19,126 25,284 24,762 24,290 23,870 45,916 66,696 115,886 48,580 47,740 46,538 46,538 46,538 46,538 46,538 30,300 32,041 44,739 71,918 66,614 76,838 78,579 91,277 118,456 112.530 143,534 194,465 139,857 166,196 2276 Notes: a. 7.000,000 shares of common stock were outstanding throughout the period 1990 through 1992. b. Market price of shares: 1990-$17.78: 1991-89.70: 1992-53.74 c. Priceleamings (P/E) ratios 1990-6.29, 1991-4.98; 1992-11.28. The 1992 PE ratio is high because of the depressed camnings that year d. Assume that all changes in interest-bearing loans and gross fixed assets occur at the start of the relevant years. c. The mortgage loan is secured by a first-mortgage bond on land and buildings, Table 2 Net Sales Cost of Goods Sold Gross Profit Admin and Selling Expenses Depreciation Misc Expenses Total Operating Expenses EBIT Interest on Short-Term Loans Interest on Long-Term Loans Interest on Mortgage Total Interest Before-Tax Earnings Taxes Net Income Dividends on Stock Additions to Retained Earnings Proforma 1990 1991 1992 1993 1994 350,546 378,549 401,251 441,376 507,583 282,252 311,110 342,016 364,135 304,550 68,294 67,439 59,235 77,241 101,517 25,580 30,690 33,762 35,310 38,069 3,188 3,316 4,080 4,846 3,646 4,054 7,114 11,450 7,724 6,345 32,822 41,120 49,292 47,880 48,060 35,472 26,319 9,943 29,361 53,457 638 1,122 3,647 5,906 5,906 1,339 2,008 2,008 1,912 1,912 516 468 421 379 341 2,493 3,598 6,076 8,197 8,159 32,979 22,721 3,867 21,164 45,298 13,192 9,088 1,547 8,465 18,119 19,787 13,632 2,320 12,698 27,179 4,947 3,408 580 0 0 14,841 10,224 1,740 12,698 27,179 Notes: 2. Eamings per share (EPS): 1990-$2,69; 1991-S181; 1992-80.22. b. Interest rates on borrowed funds: Short-term loan: 1990-10%; 1991-11%; 1992-10% Long-term loan: 10% for each year. Mortgage: 9% for each year. c. For purposes of this case, assume that expenses other than depreciation and interest are totally variable with sales. Table 3 1990 1991 1992 5.13% 25.72 3.37% 30.19 8.82% 30.39 35.36 74.55 48.32 Assets: Cash and Marketable Securities Accounts Receivable Inventory Current Assets Land, Buildings, Plant, and Equipment Accumulated Depreciation Net Fixed Assets Total Assets 50.39 79.18 83.94 30.78 (5.32) 25.45% 27.31 22.94 (6.48) (6.88) 20.82% 16.05% 100 100 100 Liabilities and Equities: Short-term Bank Loans Accounts Payable Acrruals Current Liabilities Long-term Bank Loans Mortgage Long-Term Debt Total Liabilities Common Sotck Retained Earnings Total Equity Total Liabilities and Equity 5.67% 12.02 6.12 23.81% 11.90% 5.10 17.00% 40.80% 18.75% 20.57 7.54 46.86% 10.32 2.41 7.11% 14.64 7.11 28.85% 13.99% 3.62 17.62% 46.47% 32.42% 21.11 53.53% 100.00% 41.36% 17.84 59.20% 100.00% 59.59% 23.93% 16.47 40.41% 100.00% Table 4 1990 1991 1992 Net Sales 100.00% 100.00% 100.00% Cost of Goods Sold 80.52 82.18 85.23 Gross Profit 19.48% 17.82% 14.76% Admin and Selling Expenses 7.30% 8.11% 8.41% Depreciation 0.91 0.88 0.01 Misc Expenses 1.16 1.88 2.85 Total Operating Expenses 9.36% % 10.86% 2.28% EBIT 10.12% 6.95% 2.48% Interest on Short-Term Loans 0.18% 0.30% 0.01% Interest on Long-Term Loans 0.38% 0.53% 0.01% Interest on Mortgage 0.15 0.12 0.1 Total Interest 0.71% 0.95% 1.51% Before-Tax Earnings 9.41% 6.00% 0.96% Taxes 3.76 2.4 0.003 Net Income 5.64% 3.60% 0.58% Dividends on Stock 1.41% 0.90% 0.14% Additions to Retained Earnings 4.23% 2.70% 0.43% Table 5 1991 1992 Cash Flow from Operations Sales Increase in Receivables Cash Sales Cost of Goods Sold Increase in Inventories Increase in Accts Payable Increase in Accruals Cash Cost of Goods Cash Margin Admin and Selling Expense Misc Expense Taxes Net Cash Flow from Operations 378,549.00 401,205.00 (2,728.00) 21,790.00 375,821.00 379,461.00 (311,110.00) (342,016.00) (29,570.00) (28,623.00) 7,484.00 18,984.00 3,314.00 4,462.00 (329,882.00) (347,193.00) 45,939.00 32,268.00 (30,690.00) (33,762.00) (7,114.00) (11,450.00) (9,088.00) (1,547.00) (953.00) (14,491.00) Cash Flow from Fixed Asset Investment Investment in Fixed Assets (4,561.00) (5,409.00) Cash Flow from Financing Activities Increase in Short-Term Debt Increase in Long-Term Debt Repayment of Mortgage Interest Expense Common Dividends 3,824.00 6,694.00 (536.00) (3,598.00) (3,408.00) 26,266.00 0.00 (522.00) (6,076.00) (580.00) Net Cash Flow from Financing Activities Increase (Decrease) in Cash & Marketable Securities 2,976.00 19,088.00 (2,539.00) (812.00) B E G D Table 6 Pro Forma 1993 1994 Industry Average 1990 1991 1992 Liquidity Ratio: Current Ratio Quick Ratio 3.13 1.65 2.74 1.07 1.59 0.72 B 1.13 D 2.5 1 Leverage Ratio: Debt Ratio TIE Coverage F 40.80% 14.23 46.47% 61.17% 7.31 1.64 52.31% 6.55 50.00% 7.7 5.7 - Asset Management Ratios: Inventory Turnover (sale) Inventory Turnover (sale) Fixed Asset Turnover Total Asset Turnover Days Sale Outstanding (ACH 7.09 8.81 12.24 3.12 35.12 4.49 5.46 12.67 2.64 35.11 3.49 4.1 12.85 2.063 52.68 5.7 H 11.38 2.05 L 13.77 K 32 5.7 7 12 3 32 Profitability Ratio: Profit Margin Gross Profit Margin Return on Total Assets ROE 5.64% 19.48% 17.58% 29.70% 3.60% 17.82% 9.50% 17.74% 0.58% 14.76% 5.10% 2.95% M 17.50% 5.90% P N 20.00% 10.94% Q 2.90% 18.00% 8.80% 17.50% Other Ratio: Altman Z Score Payout Ratio 6.64% 25.00% 4.75% 3.3131 25.00% 25.00% 3.95 0.00% 5.42 S 4.65% 20.00% Un cord theme 20.012,-0.014,3X, X, X, X, - woking capital X-me value of new world www we end per Chapter 26 ore F. Bam and Les Year- chance-sheet we were in the comedy hacemos A considstry-erotos that the period 1990 1994 Table 1 Proforma 1993 1994 1990 1991 1992 Assets: Cash and Marketable Securities Accounts Receivable Inventory Current Assets Land, buildings, plants, and equipm Accumulated Depreciation Net Fixed Assets Total Assets 9,930 7,363 6,550 A B 34,196 36,924 58,714 C D 39,791 69,361 97,984 E F 83,888 113,647 163,249 G H 34,634 39,190 44,604 57,036 58,746 -5,992 -9,308 -13,388 -18,234 -21,880 28,642 29,887 31,216 38,802 36,866 112,530 143,534 194,465 215,375 1 Liabilities and Equity: Short-Term Bank Loans Accounts Payable Accruals Current Liabilities Long-Term Bank Loans Mortgage Long-Term Debt Total Liabilities Common Stock Retained Earnings Total Equity Total Liabilities and Equity 6,376 10,200 36,466 49,216 49,126 13,528 21,012 39,996 31,990 33,590 6,886 10,200 14,662 18,602 23,252 26,790 41,412 91,124 99,808 105,968 13,388 20,082 20,082 20,082 20,082 5,738 5,202 4,680 4,208 3,788 19,126 25,284 24,762 24,290 23,870 45,916 66,696 115,886 48,580 47,740 46,538 46,538 46,538 46,538 46,538 30,300 32,041 44,739 71,918 66,614 76,838 78,579 91,277 118,456 112.530 143,534 194,465 139,857 166,196 2276 Notes: a. 7.000,000 shares of common stock were outstanding throughout the period 1990 through 1992. b. Market price of shares: 1990-$17.78: 1991-89.70: 1992-53.74 c. Priceleamings (P/E) ratios 1990-6.29, 1991-4.98; 1992-11.28. The 1992 PE ratio is high because of the depressed camnings that year d. Assume that all changes in interest-bearing loans and gross fixed assets occur at the start of the relevant years. c. The mortgage loan is secured by a first-mortgage bond on land and buildings, Table 2 Net Sales Cost of Goods Sold Gross Profit Admin and Selling Expenses Depreciation Misc Expenses Total Operating Expenses EBIT Interest on Short-Term Loans Interest on Long-Term Loans Interest on Mortgage Total Interest Before-Tax Earnings Taxes Net Income Dividends on Stock Additions to Retained Earnings Proforma 1990 1991 1992 1993 1994 350,546 378,549 401,251 441,376 507,583 282,252 311,110 342,016 364,135 304,550 68,294 67,439 59,235 77,241 101,517 25,580 30,690 33,762 35,310 38,069 3,188 3,316 4,080 4,846 3,646 4,054 7,114 11,450 7,724 6,345 32,822 41,120 49,292 47,880 48,060 35,472 26,319 9,943 29,361 53,457 638 1,122 3,647 5,906 5,906 1,339 2,008 2,008 1,912 1,912 516 468 421 379 341 2,493 3,598 6,076 8,197 8,159 32,979 22,721 3,867 21,164 45,298 13,192 9,088 1,547 8,465 18,119 19,787 13,632 2,320 12,698 27,179 4,947 3,408 580 0 0 14,841 10,224 1,740 12,698 27,179 Notes: 2. Eamings per share (EPS): 1990-$2,69; 1991-S181; 1992-80.22. b. Interest rates on borrowed funds: Short-term loan: 1990-10%; 1991-11%; 1992-10% Long-term loan: 10% for each year. Mortgage: 9% for each year. c. For purposes of this case, assume that expenses other than depreciation and interest are totally variable with sales. Table 3 1990 1991 1992 5.13% 25.72 3.37% 30.19 8.82% 30.39 35.36 74.55 48.32 Assets: Cash and Marketable Securities Accounts Receivable Inventory Current Assets Land, Buildings, Plant, and Equipment Accumulated Depreciation Net Fixed Assets Total Assets 50.39 79.18 83.94 30.78 (5.32) 25.45% 27.31 22.94 (6.48) (6.88) 20.82% 16.05% 100 100 100 Liabilities and Equities: Short-term Bank Loans Accounts Payable Acrruals Current Liabilities Long-term Bank Loans Mortgage Long-Term Debt Total Liabilities Common Sotck Retained Earnings Total Equity Total Liabilities and Equity 5.67% 12.02 6.12 23.81% 11.90% 5.10 17.00% 40.80% 18.75% 20.57 7.54 46.86% 10.32 2.41 7.11% 14.64 7.11 28.85% 13.99% 3.62 17.62% 46.47% 32.42% 21.11 53.53% 100.00% 41.36% 17.84 59.20% 100.00% 59.59% 23.93% 16.47 40.41% 100.00% Table 4 1990 1991 1992 Net Sales 100.00% 100.00% 100.00% Cost of Goods Sold 80.52 82.18 85.23 Gross Profit 19.48% 17.82% 14.76% Admin and Selling Expenses 7.30% 8.11% 8.41% Depreciation 0.91 0.88 0.01 Misc Expenses 1.16 1.88 2.85 Total Operating Expenses 9.36% % 10.86% 2.28% EBIT 10.12% 6.95% 2.48% Interest on Short-Term Loans 0.18% 0.30% 0.01% Interest on Long-Term Loans 0.38% 0.53% 0.01% Interest on Mortgage 0.15 0.12 0.1 Total Interest 0.71% 0.95% 1.51% Before-Tax Earnings 9.41% 6.00% 0.96% Taxes 3.76 2.4 0.003 Net Income 5.64% 3.60% 0.58% Dividends on Stock 1.41% 0.90% 0.14% Additions to Retained Earnings 4.23% 2.70% 0.43% Table 5 1991 1992 Cash Flow from Operations Sales Increase in Receivables Cash Sales Cost of Goods Sold Increase in Inventories Increase in Accts Payable Increase in Accruals Cash Cost of Goods Cash Margin Admin and Selling Expense Misc Expense Taxes Net Cash Flow from Operations 378,549.00 401,205.00 (2,728.00) 21,790.00 375,821.00 379,461.00 (311,110.00) (342,016.00) (29,570.00) (28,623.00) 7,484.00 18,984.00 3,314.00 4,462.00 (329,882.00) (347,193.00) 45,939.00 32,268.00 (30,690.00) (33,762.00) (7,114.00) (11,450.00) (9,088.00) (1,547.00) (953.00) (14,491.00) Cash Flow from Fixed Asset Investment Investment in Fixed Assets (4,561.00) (5,409.00) Cash Flow from Financing Activities Increase in Short-Term Debt Increase in Long-Term Debt Repayment of Mortgage Interest Expense Common Dividends 3,824.00 6,694.00 (536.00) (3,598.00) (3,408.00) 26,266.00 0.00 (522.00) (6,076.00) (580.00) Net Cash Flow from Financing Activities Increase (Decrease) in Cash & Marketable Securities 2,976.00 19,088.00 (2,539.00) (812.00) B E G D Table 6 Pro Forma 1993 1994 Industry Average 1990 1991 1992 Liquidity Ratio: Current Ratio Quick Ratio 3.13 1.65 2.74 1.07 1.59 0.72 B 1.13 D 2.5 1 Leverage Ratio: Debt Ratio TIE Coverage F 40.80% 14.23 46.47% 61.17% 7.31 1.64 52.31% 6.55 50.00% 7.7 5.7 - Asset Management Ratios: Inventory Turnover (sale) Inventory Turnover (sale) Fixed Asset Turnover Total Asset Turnover Days Sale Outstanding (ACH 7.09 8.81 12.24 3.12 35.12 4.49 5.46 12.67 2.64 35.11 3.49 4.1 12.85 2.063 52.68 5.7 H 11.38 2.05 L 13.77 K 32 5.7 7 12 3 32 Profitability Ratio: Profit Margin Gross Profit Margin Return on Total Assets ROE 5.64% 19.48% 17.58% 29.70% 3.60% 17.82% 9.50% 17.74% 0.58% 14.76% 5.10% 2.95% M 17.50% 5.90% P N 20.00% 10.94% Q 2.90% 18.00% 8.80% 17.50% Other Ratio: Altman Z Score Payout Ratio 6.64% 25.00% 4.75% 3.3131 25.00% 25.00% 3.95 0.00% 5.42 S 4.65% 20.00% Un cord theme 20.012,-0.014,3X, X, X, X, - woking capital X-me value of new world www we end per Chapter 26 ore F. Bam and Les Year- chance-sheet we were in the comedy hacemos A considstry-erotos that the period 1990 1994
Step by Step Solution
There are 3 Steps involved in it

Get step-by-step solutions from verified subject matter experts