Question: First Draft Outline: Introduction: Introduce the Data Presentation and Analysis assignment. Summarize the previous parts of the assignment (Establishing the Problem, Research Questions, Previous Research,
First Draft Outline:
Introduction:
Introduce the Data Presentation and Analysis assignment.
Summarize the previous parts of the assignment (Establishing the Problem, Research Questions, Previous Research, and Methods).
Provide a brief overview of the purpose and content of the research.
Presentation of Data:
Discuss the process of distributing the questionnaire and collecting responses.
Include three charts or graphs presenting quantitative data.
Explain the methods used to create the charts/graphs (e.g., Google Forms, Excel).
Include quotes or excerpts from qualitative responses to support the findings.
Analysis of Data:
Title and caption for each chart/graph.
Analyze each chart/graph, discussing both the data and its significance.
Connect the data to larger concepts and previous research.
Use qualitative data to provide depth and support to the quantitative findings.
Discuss how the data addresses the research problem and question(s).
Discussion:
Interpret the results of the research.
Provide a summary of the main findings.
Develop 3-4 questions for further research in the field.
Assignment Review:
a letter format addressing the reader.
Reflect on the process of composing the assignment.
Discuss initial thoughts and struggles in the first draft.
Reflect on feedback received from peers.
Describe revisions made for the final draft.
Provide specific examples of writing process and changes.
Reflection Letter:
Address the reader as "Dear Reader".
Introduction discussing the purpose of the reflection letter.
Reflect on what was easy and what was challenging in the writing process.
Discuss changes in ideas and perspectives throughout the assignment.
Detail important revisions made and rationale behind decisions.
Describe how feedback from peers and instructor influenced revisions.
Discuss how writing and the writing process have evolved.
Final Draft with Graphs Outline: (The same structure as the first draft outline, but with the addition of the finalized charts/graphs within the Presentation of Data section.)
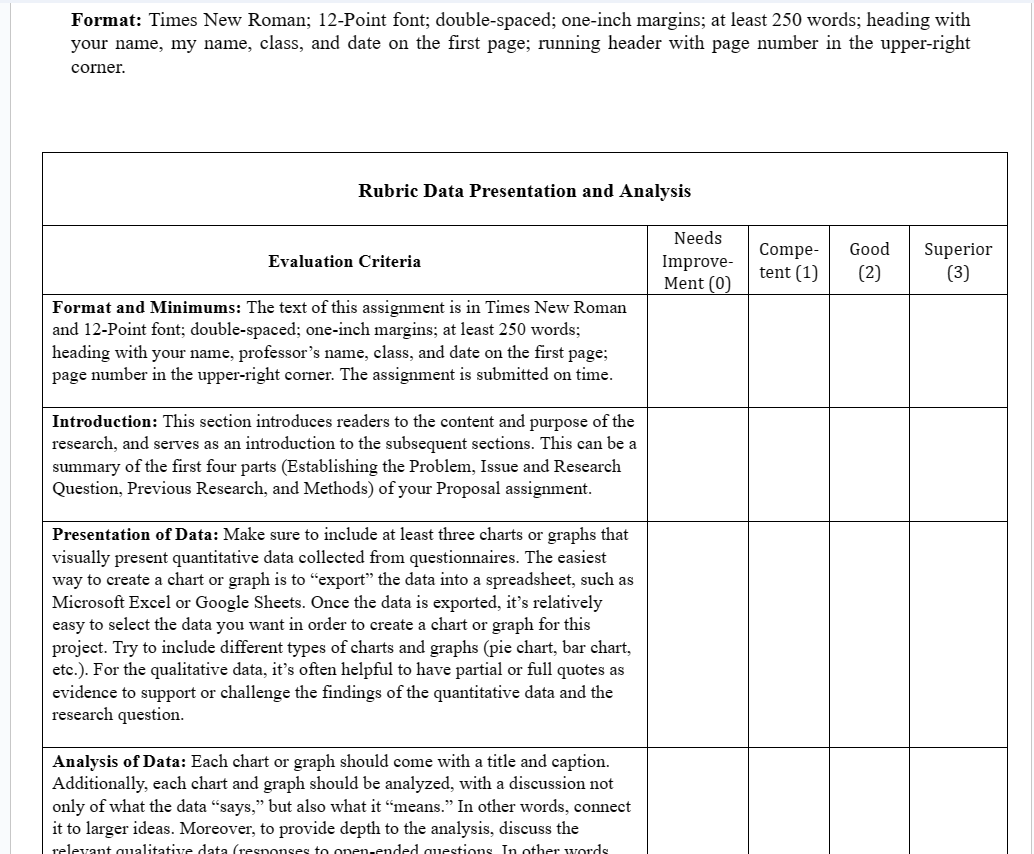
First Draft, Final Draft, Assignment Review, & Reflection Letter are due on your Portfolio site Final Draft is also due on Blackboard via the \"Assignments\" link Directions: The Data Presentation and Analysis assignment is the culmination of your work over the past few weeks. At this point, you have developed a set of research questions, completed a Proposal, designed a methodology to address your research questions, and completed a questionnaire. It 1s now the time to conduct the research--acquire, analyze, and present your data and discuss your findings. Welcome to the Data Presentation and Analysis assignment! Learning OQutcomes (By completing this assignment, students should be able to): Understand the difference between primary and secondary research e Conduct primary research e Understand, acquire, display, and analyze qualitative and quantitative data e Discuss qualitative and quantitative data within the context of previous research Requirements: As the title suggests, there are two parts of this assignment: the presentation of data and the analysis of data. The first step is to send out the questionnaire (completed as part of your Proposal assignment) to as many people as possible. You can use email, text, social media, or whatever methods work best for you. You should aim for as many responses as possible, as the more responses you receive, the more reliable your data will be. Aim for twenty (20) responses. The minimum number of responses required for this assignment is ten (10). The assignment should include the following sections: Introduction: This section should introduce your work. For the most part, this can be a summary of the first four parts (Establishing the Problem, Issue and Research Question, Previous Research, and Methods) of your Proposal assignment. The goal of this section is to introduce readers to the content and purpose of the research, in addition to serving as an introduction to the subsequent sections. Presentation of Data: Make sure to include at least three charts or graphs that visually present quantitative data collected from your questionnaires. If you are using Google Forms, you can obtain the charts and graphs while checking for your responses. Another method to create a chart or graph is to \"export\" the data into a spreadsheet, such as Microsoft Excel or Google Sheets. Once the data is exported, it's relatively easy to select the data you want in order to create a chart or graph for this project. Try to include different types of charts and graphs (pie chart, bar chart, etc.). For the qualitative data, it's often helpful to have partial or full quotes as evidence to support or challenge the findings of the quantitative data and the research question. Analysis of Data: Each chart or graph should come with a title and caption. Additionally, each chart and graph should be analyzed, with a discussion not only of what the data \"says,\" but also what it \"means.\" In other words, connect it to larger ideas. Moreover, to provide depth to the quantitative data, discuss the relevant qualitative data (responses to open-ended questions). Make sure to use the qualitative data to support and discuss the quantitative data. Finally, when analyzing data, you want to clearly discuss how the acquired data is relevant to the research problem, the research question(s), and the variables for the study. Overall, you want to make sure to discuss how the data analysis is directly related to answering (or not answering) the research question. It is completely fine if your analysis does not answer the research question. If this is the case, you should say so. Discussion: In this section, you want to make sure that the results are thoroughly interpreted. The interpretation of the results of the research and data should be thoughtful and insightful. Make sure to provide a final message that reminds readers of the main findings of the research. Finally, develop 3-4 questions that still remain unanswered, suggesting possible avenues for further research in this area, and/or field of study to address those unanswered questions. Format and minimums: The text of this assignment should be in Times New Roman and 12-Point font: double-spaced; one-inch margins; at least 250 words; heading with your name, professor's name, class, and date on the first page: page number in the upper-right corner. Assignment Review Instructions: The Assignment Review should be in the form of a letter (not a list), at least 250 words (about a page double-spaced), and uploaded to your Portfolio site. Because the Assignment Review is meant to help with your Final Draft and contains the same steps that the professor will go through when grading your Final Draft, vou should complete the Assignment Review after the First Draft but before the Final Draft. All of the information and instructions to complete the Assignment Review can be found on this worksheet: https://docs.google.com/document/d/1 FvtgkwufiepHihindhQzD659509gyW-rgskDIG-S 1 XU/edit?usp=sharin: Reflection Letter Introduction: The Reflection letter is a different \"Rhetorical Situation\" from the assignment. Importantly, it is a different genre with a different purpose. In your Reflection Letter, you should discuss the process you undertook to compose the different parts of the assignment. By the time the final draft of the assignment is finished and submitted, you will have composed two drafts and received peer review from a classmate. As a result, the goal is to convey to the reader your initial thoughts and struggles in putting together your first draft. Next, reflect upon the feedback vou received from your classmate during the peer review. What was helpful? What revisions did you make for your final draft? Overall, in your Reflection Letter, you want to provide specific examples of your writing process. In other words, use your own writing as evidence to support your claims. Instructions: Begin the Reflection letter with \"Dear Reader\" and end with a closing, such as \"Sincerely,\" \"Regards,\" \"Yours truly,\" etc. There should be an introduction and conclusion, and each body paragraph should be logically organized around one main idea. Make sure that each paragraph has a unique claim, supported by evidence (examples from your essay or comments from your peers or professor), and a \"warrant that connects the evidence to the claims. Make sure to discuss your use of Rhetorical Terms, peer feedback, instructor feedback, and specific changes from first to second to final draft. Additionally, before you begin to write, you might ask yourself the following questions: What was easy? What did you struggle with? What did you learn about the topic and your own writing? How did your ideas change? What further information would you like to find out about the topic? You also might consider the following: important revisions you made in the process of writing; decisions you made in building your essay, and rationale for these decisions; challenges with specific parts of the assignments; what you learned from the author you read; how you look at writing differently than when you began; how your writing has changed; how your writing process has changed. Format: Times New Roman; 12-Point font; double-spaced; one-inch margins; at least 250 words; heading with your name, my name, class, and date on the first page; running header with page number in the upper-right corner. Rubric Data Presentation and Analysis Needs : . Lo Compe- | Good Superior Evaluation Criteria Improve- tent (1) @) 3) Ment (0) Format and Minimums: The text of this assignment is in Times New Roman and 12-Point font: double-spaced: one-inch margins: at least 250 words: heading with your name. professor's name, class. and date on the first page: page number in the upper-right corner. The assignment is submitted on time. Introduction: This section introduces readers to the content and purpose of the research, and serves as an introduction to the subsequent sections. This can be a summary of the first four parts (Establishing the Problem, Issue and Research Question, Previous Research, and Methods) of your Proposal assignment. Presentation of Data: Make sure to include at least three charts or graphs that visually present quantitative data collected from questionnaires. The easiest way to create a chart or graph is to \"export\" the data into a spreadsheet. such as Microsoft Excel or Google Sheets. Once the data is exported. it's relatively easy to select the data you want in order to create a chart or graph for this project. Try to include different types of charts and graphs (pie chart. bar chart, ete.). For the qualitative data. it's often helpful to have partial or full quotes as evidence to support or challenge the findings of the quantitative data and the research question. Analysis of Data: Each chart or graph should come with a title and caption. Additionally, each chart and graph should be analyzed. with a discussion not only of what the data \"says.\" but also what it \"means.\" In other words, connect it to larger ideas. Moreover, to provide depth to the analysis, discuss the ralatrant Amalitativa data freaenancas tn anencandad mactinne Tn athar warde use the qualitative data to support and discuss the quantitative data. Finally, when you are analyzing the data, you want to clearly discuss how the acquired data is relevant to the research problem, the research question, and the variables for the study. Overall, you want to make sure that the data analysis is directly connected to answering the research question. Discussion: The results are thoroughly interpreted. The interpretation of the results of the research and data should be thoughtful and insightful. There is a final message that reminds readers of the main findings of the research. There are 3-4 questions that still remain unanswered, suggesting possible avenues for further research in this area, and/or field of study to address those unanswered questions. Assignment Review: The Assignment Review has been completed and uploaded to your Digication site. All the prompts are addressed. and the document is in the narrative form of a letter, not simply a list of answered questions. It is at least 250 words. Reflection Letter: Format: Times New Roman; 12-Point font: double-spaced; one-inch margins; at least 250 words: heading with your name. my name. class, and date on the first page; running header with page number in the upper-right corner. e Content: Are the introduction and conclusion adequate at \"framing\" the contents of the letter? Is each body paragraph logically organized around one main idea? Does each paragraph have a unique claim, supported by evidence (examples from your essay or comments from your peers or professor), and a \"warrant\" that connects the evidence to the claims? Reflection: Discussion of specific peer feedback, instructor feedback. and snecific chanees from first to final draft. nugusu vl Data Presentation and Analysis: Assignment Review Worksheet 1. Read through the piece once without making any marks. 2. Begin an email to your partner that begins with \"Dear (their name)\" and ends with a formal closing, such as \"Sincerely (your name).\" 3. For an introduction, write 5-10 sentences about your first impression. What can be improved? Using the rubric below, in narrative form (not a list), please address all of the prompts/questions for each part. Write in complete sentences, in narrative form, using transitions (Don't just make a list). 5. Give yourself a grade using the rubric. Rubric Data Presentation and Analysis Needs . . Lo Compe- | Good Superior Evaluation Criteria Improve- tent (1 9 3 Mont (0) | 3) Format and Minimums: The text of this assignment is in Times New Roman and 12-Point font: double-spaced: one-inch margins: at least 250 words: heading with your name, professor's name, class, and date on the first page; page number in the upper-right corner. The assignment is submitted on time. Introduction: This section introduces readers to the content and purpose of the research, and serves as an introduction to the subsequent sections. This can be a summary of the first four parts (Establishing the Problem, Issue and Research Question, Previous Research, and Methods) of your Proposal assignment. Presentation of Data: Make sure to include at least three charts or graphs that visually present quantitative data collected from questionnaires. The easiest way to create a chart or graph is to \"export the data into a spreadsheet, such as Microsoft Excel or Google Sheets. Once the data is exported, it's relatively casy to select the data you want in order to create a chart or graph for this project. Try to include different types of charts and graphs (pie chart, bar chart, ete.). For the qualitative data, it's often helpful to have partial or full quotes as evidence to support or challenge the findings of the quantitative data and the research question. Analysis of Data: Each chart or graph should come with a title and caption. Additionally, each chart and graph should be analyzed. with a discussion not only of what the data \"says.\" but also what it \"means.\" In other words, connect it to larger ideas. Moreover, to provide depth to the analysis, discuss the relevant qualitative data (responses to open-ended questions. In other words, use the qualitative data to support and discuss the quantitative data. Finally, when you are analyzing the data, you want to clearly discuss how the acquired data is relevant to the research problem, the research question. and the variables for the study. Overall, you want to make sure that the data analysis is directly connected to answering the research question. Discussion: The results are thoroughly interpreted. The interpretation of the results of the research and data should be thoughtful and insightful. There is a final message that reminds readers of the main findings of the research. There are 3-4 questions that still remain unanswered, suggesting possible avenues for further research in this area. and/or field of study to address those unanswered Assignment Review: The Assignment Review has been completed and uploaded to your Digication site. All the prompts are addressed, and the document is in the narrative form of a letter. not simply a list of answered n/a n/a n/a n/a questions. It is at least 250 words. Reflection Letter: Format: Times New Roman; 12-Point font; double-spaced: one-inch margins; at least 250 words; heading with your name, my name, class, and date on the first page: running header with page number in the upper-right corner. e Content: Are the introduction and conclusion adequate at \"framing\" the contents of the letter? Is each body paragraph logically organized around one main idea? Does each paragraph have a unique claim, | n/a n/a n/a n/a supported by evidence (examples from your essay or comments from your peers or professor), and a \"warrant\" that connects the evidence to the claims? e Reflection: Discussion of specific peer feedback, instructor feedback, and specific changes from first to final draft
Step by Step Solution
There are 3 Steps involved in it
1 Expert Approved Answer
Step: 1 Unlock
Question Has Been Solved by an Expert!
Get step-by-step solutions from verified subject matter experts
Step: 2 Unlock
Step: 3 Unlock
Students Have Also Explored These Related Business Writing Questions!