

Question: First drop down choices are surplus or deficit. Second one is grew, shrank, or remained the same. The third one is also grew,shrank, or remained
First drop down choices are surplus or deficit. Second one is grew, shrank, or remained the same. The third one is also grew,shrank, or remained the same
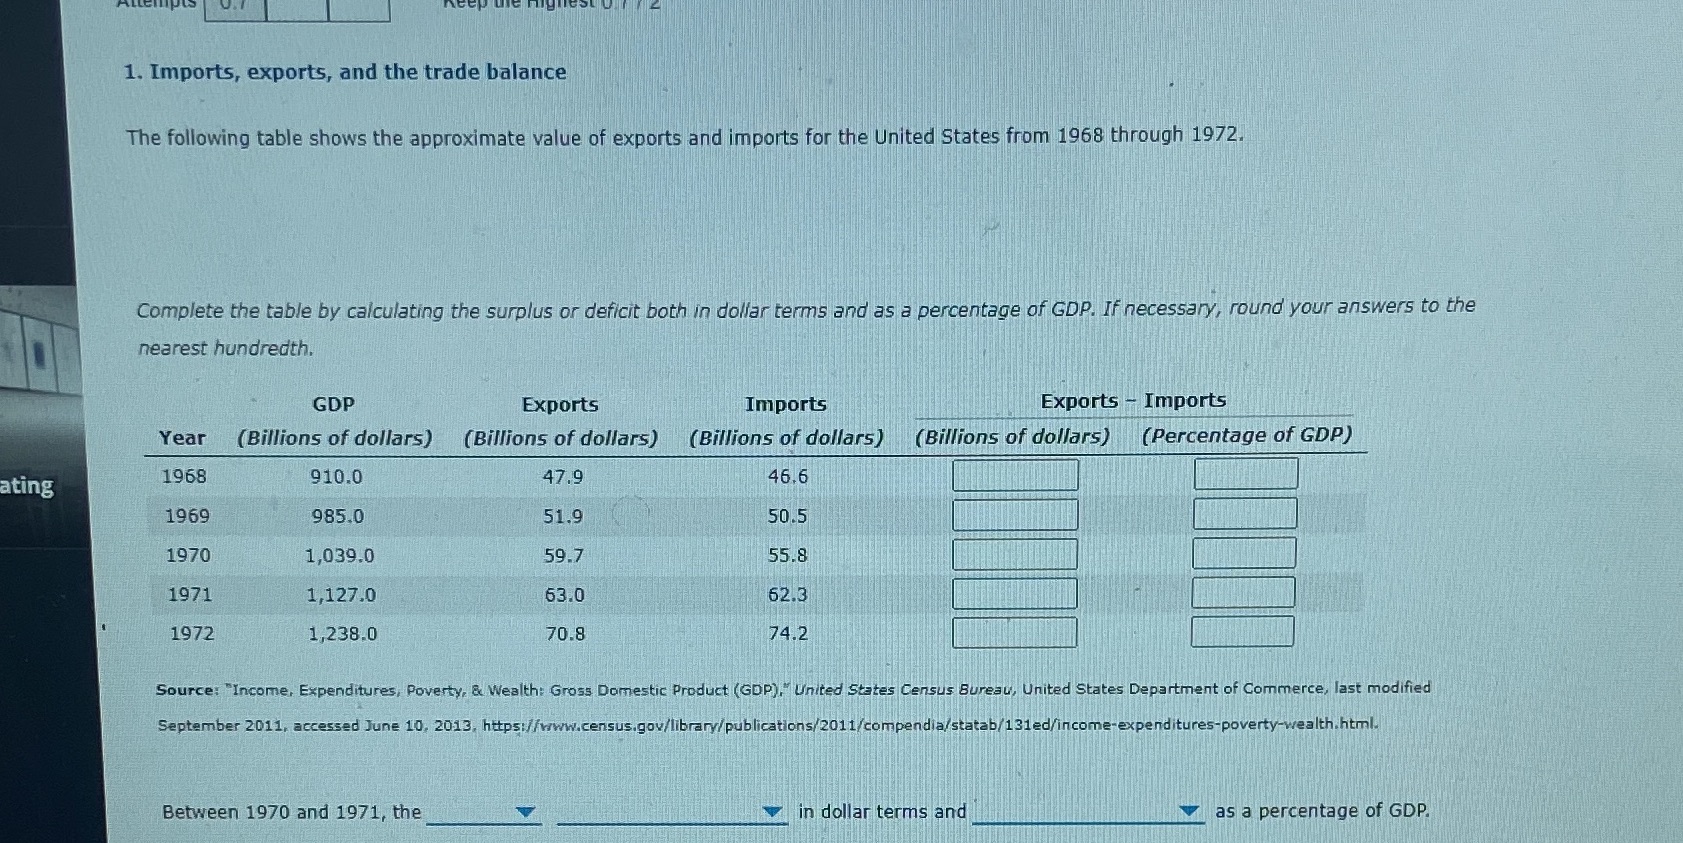
1. Imports, exports, and the trade balance The following table shows the approximate value of exports and imports for the United States from 1968 through 1972. Complete the table by calculating the surplus or deficit both in dollar terms and as a percentage of GDP. If necessary, round your answers to the nearest hundredth. GDP Exports Imports Exports - Imports Year (Billions of dollars) (Billions of dollars) ( Billions of dollars) (Billions of dollars) (Percentage of GDP) ating 1968 910.0 47.9 46.6 1969 985.0 51.9 50.5 1970 1,039.0 59.7 55.8 1971 1,127.0 63.0 62.3 1972 1,238.0 70.8 74.2 Source: "Income, Expenditures, Poverty, & Wealth: Gross Domestic Product (GDP)," United States Census Bureau, United States Department of Commerce, last modified September 2011, accessed June 10, 2013, https://www.census.gov/library/publications/2011/compendia/statab/131ed/income-expenditures-poverty-wealth.html. Between 1970 and 1971, the in dollar terms and as a percentage of GDP
Step by Step Solution
There are 3 Steps involved in it

Get step-by-step solutions from verified subject matter experts