

Question: First drop down options are (Bias or no bias) second is (Is not or is) 3. What is the MAD, the MSE, the MAPE, the
First drop down options are (Bias or no bias)
second is (Is not or is)
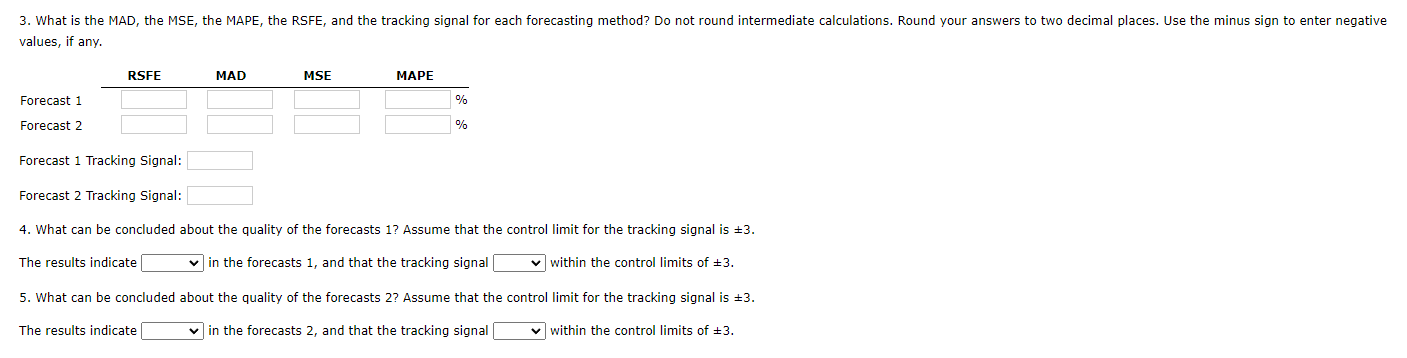
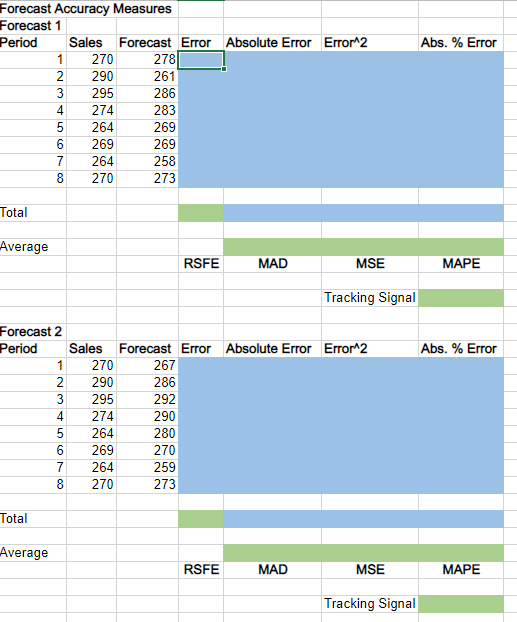
3. What is the MAD, the MSE, the MAPE, the RSFE, and the tracking signal for each forecasting method? Do not round intermediate calculations. Round your answers to two decimal places. Use the minus sign to enter negative values, if any. RSFE MAD MSE MAPE Forecast 1 % Forecast 2 % Forecast 1 Tracking Signal: Forecast 2 Tracking Signal: 4. What can be concluded about the quality of the forecasts 1? Assume that the control limit for the tracking signal is +3. The results indicate in the forecasts 1, and that the tracking signal within the control limits of +3. 5. What can be concluded about the quality of the forecasts 2? Assume that the control limit for the tracking signal is +3. The results indicate in the forecasts 2, and that the tracking signal within the control limits of +3. Abs. % Error Forecast Accuracy Measures Forecast 1 Period Sales Forecast Error Absolute Error Error2 1 270 278 2 290 261 3 295 286 4 274 283 5 264 269 6 269 269 7 264 258 8 270 273 NM CONCO Total Average RSFE MAD MSE MAPE Tracking Signal Abs. % Error Forecast 2 Period Sales Forecast Error Absolute Error Error2 1 270 267 2 290 286 3 295 292 4 274 290 5 264 280 6 269 270 7 264 259 8 270 273 NM LOCO Total Average RSFE MAD MSE MAPE Tracking Signal 3. What is the MAD, the MSE, the MAPE, the RSFE, and the tracking signal for each forecasting method? Do not round intermediate calculations. Round your answers to two decimal places. Use the minus sign to enter negative values, if any. RSFE MAD MSE MAPE Forecast 1 % Forecast 2 % Forecast 1 Tracking Signal: Forecast 2 Tracking Signal: 4. What can be concluded about the quality of the forecasts 1? Assume that the control limit for the tracking signal is +3. The results indicate in the forecasts 1, and that the tracking signal within the control limits of +3. 5. What can be concluded about the quality of the forecasts 2? Assume that the control limit for the tracking signal is +3. The results indicate in the forecasts 2, and that the tracking signal within the control limits of +3. Abs. % Error Forecast Accuracy Measures Forecast 1 Period Sales Forecast Error Absolute Error Error2 1 270 278 2 290 261 3 295 286 4 274 283 5 264 269 6 269 269 7 264 258 8 270 273 NM CONCO Total Average RSFE MAD MSE MAPE Tracking Signal Abs. % Error Forecast 2 Period Sales Forecast Error Absolute Error Error2 1 270 267 2 290 286 3 295 292 4 274 290 5 264 280 6 269 270 7 264 259 8 270 273 NM LOCO Total Average RSFE MAD MSE MAPE Tracking SignalStep by Step Solution
There are 3 Steps involved in it
1 Expert Approved Answer
Step: 1 Unlock

Question Has Been Solved by an Expert!
Get step-by-step solutions from verified subject matter experts
Step: 2 Unlock
Step: 3 Unlock