

Question: First, format the income statement below to make it look professional for exhibit purposes. Also, format the Net Income cells (row 26) so that
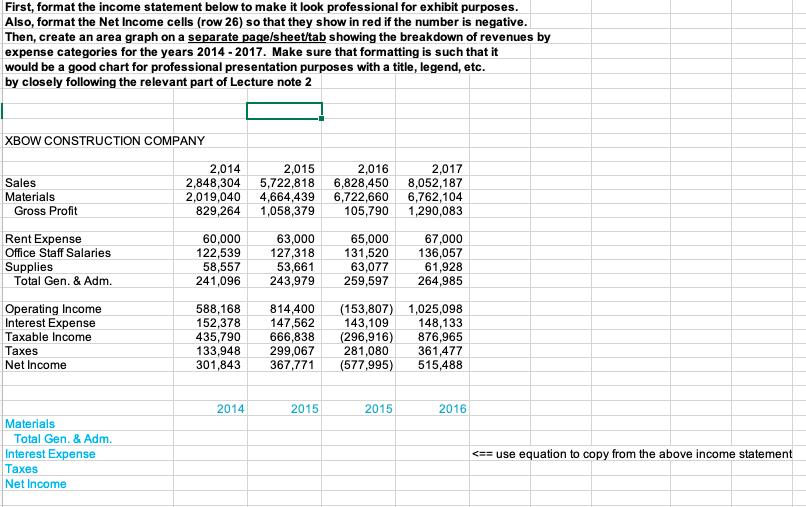
First, format the income statement below to make it look professional for exhibit purposes. Also, format the Net Income cells (row 26) so that they show in red if the number is negative. Then, create an area graph on a separate page/sheet/tab showing the breakdown of revenues by expense categories for the years 2014-2017. Make sure that formatting is such that it would be a good chart for professional presentation purposes with a title, legend, etc. by closely following the relevant part of Lecture note 2 XBOW CONSTRUCTION COMPANY Sales Materials Gross Profit Rent Expense Office Staff Salaries Supplies Total Gen. & Adm. Operating Income Interest Expense Taxable Income Taxes Net Income Materials Total Gen. & Adm. Interest Expense Taxes Net Income 2,015 2,016 2,014 2,848,304 2,019,040 5,722,818 6,828,450 4,664,439 6,722,660 829,264 1,058,379 105,790 60,000 122,539 58,557 241,096 63,000 127,318 53,661 243,979 588,168 152,378 147,562 435,790 666,838 133,948 299,067 301,843 367,771 2014 65,000 131,520 63,077 259,597 2015 814,400 (153,807) 1,025,098 143,109 (296,916) 281,080 (577,995) 2,017 8,052,187 6,762,104 1,290,083 2015 67,000 136,057 61,928 264,985 148,133 876,965 361,477 515,488 2016
Step by Step Solution
3.50 Rating (170 Votes )
There are 3 Steps involved in it
Materials 2019040 4664439 4664439 6722660 18070578 ... View full answer

Get step-by-step solutions from verified subject matter experts