

Question: First, I created the table which you can see at PRODUCT ANALYSIS sheet by taking values from SEGMENTS and PRODUCTS sheet.(In order to make data
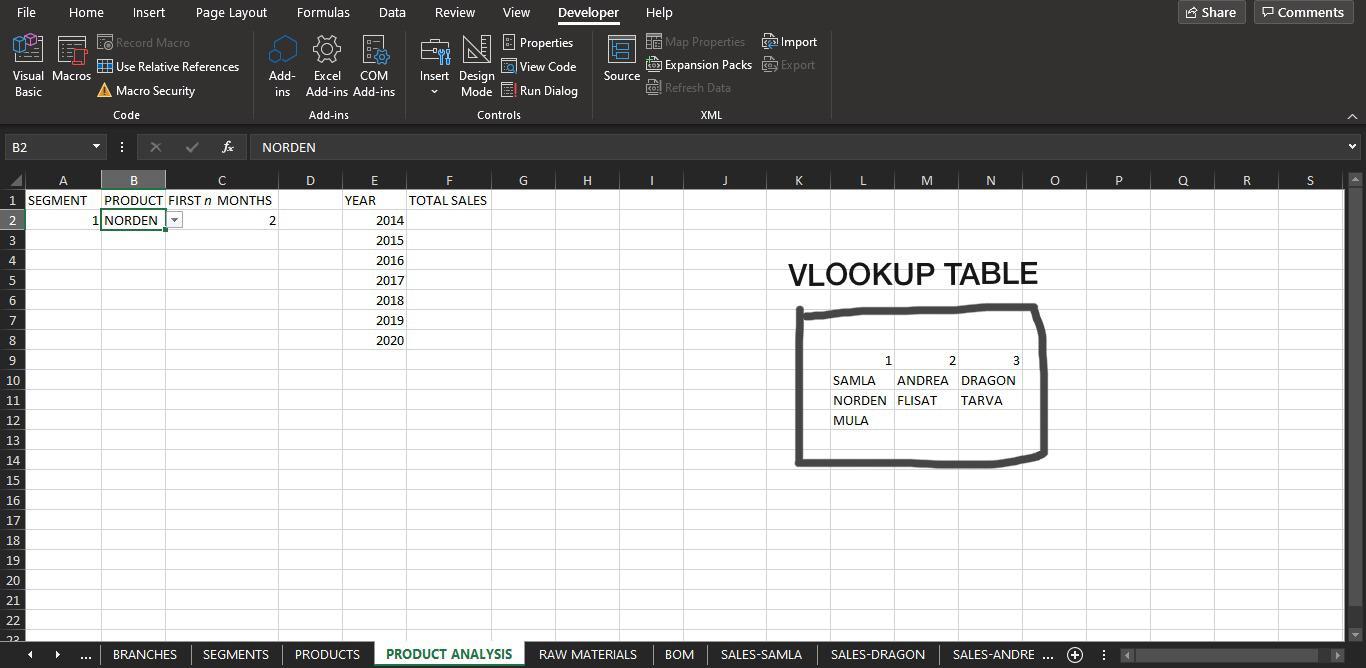 First, I created the table which you can see at PRODUCT ANALYSIS sheet by taking values from SEGMENTS and PRODUCTS sheet.(In order to make data validation easier.) Then, I used data validation in order to make dynamic product list(I mean, if user chooses 1, he/she can only choose the products with ID 1) and again by using data validation, I limited the user to write only 1-12 in "FIRST n MONTHS" column.
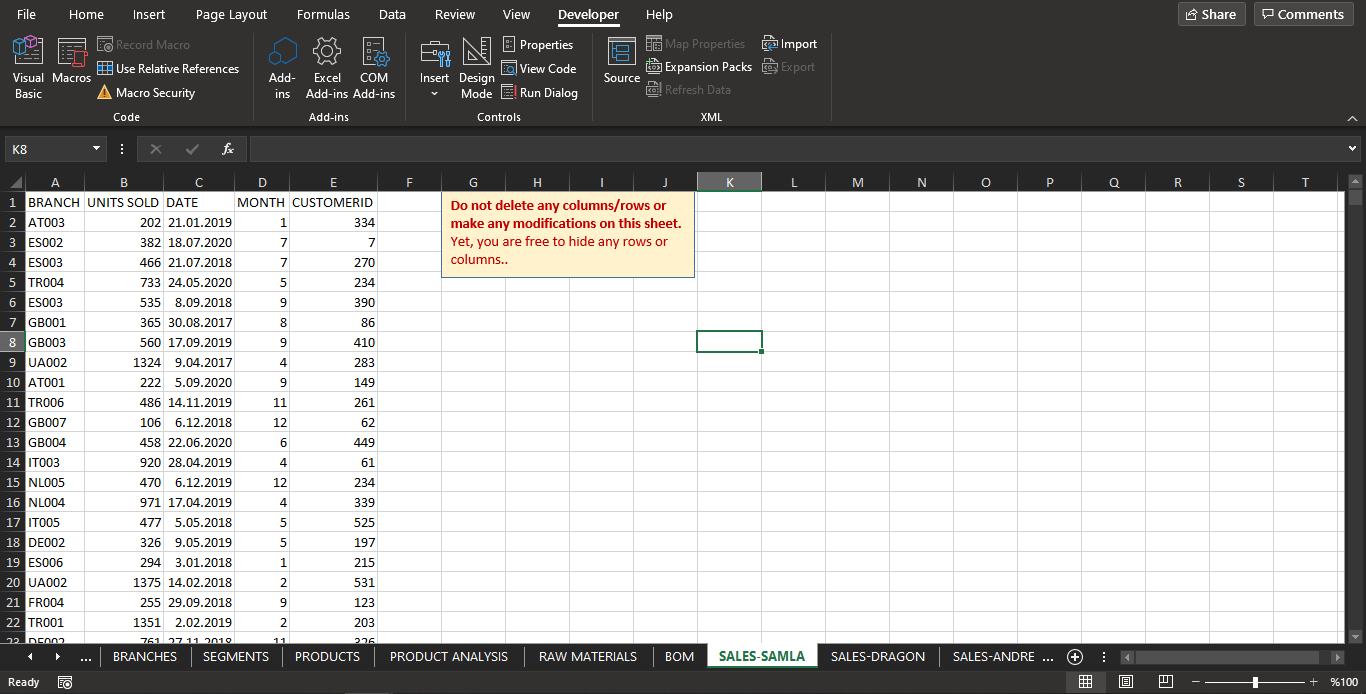
As you can see, information of SAMLA product, there are sheets about all products information.
I have to apply this part now. Please help :)
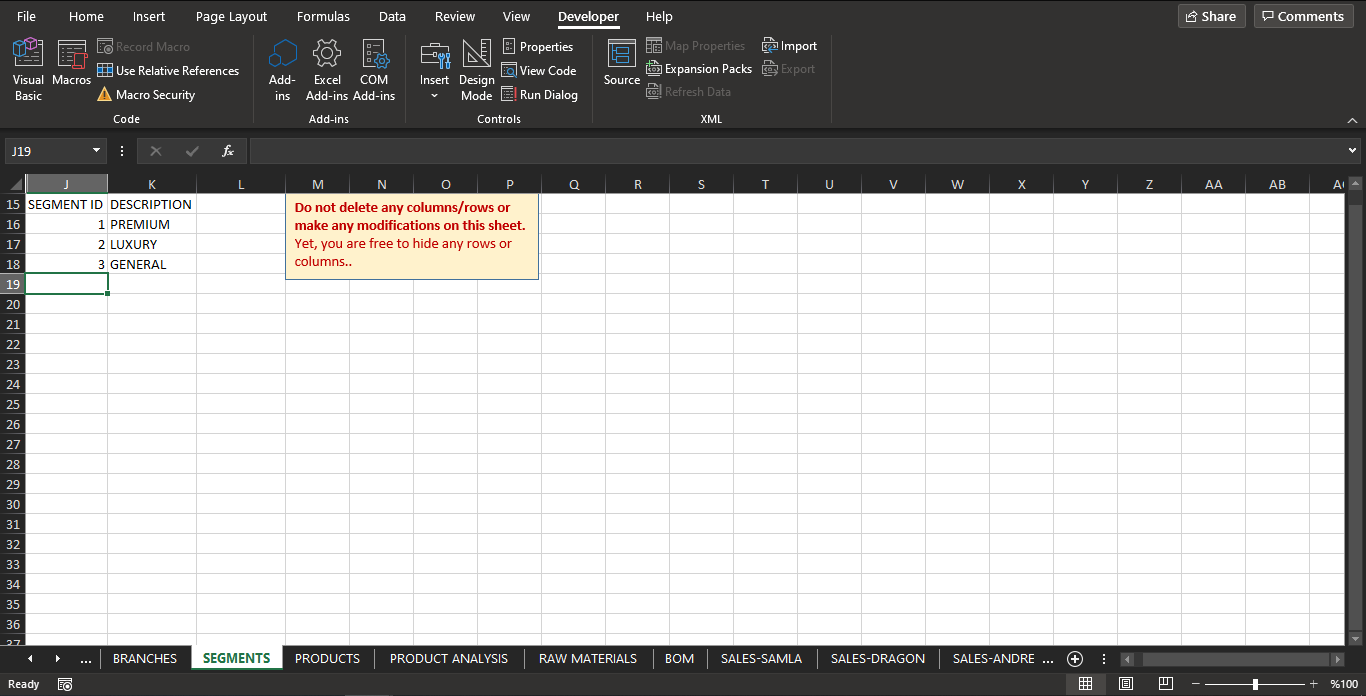
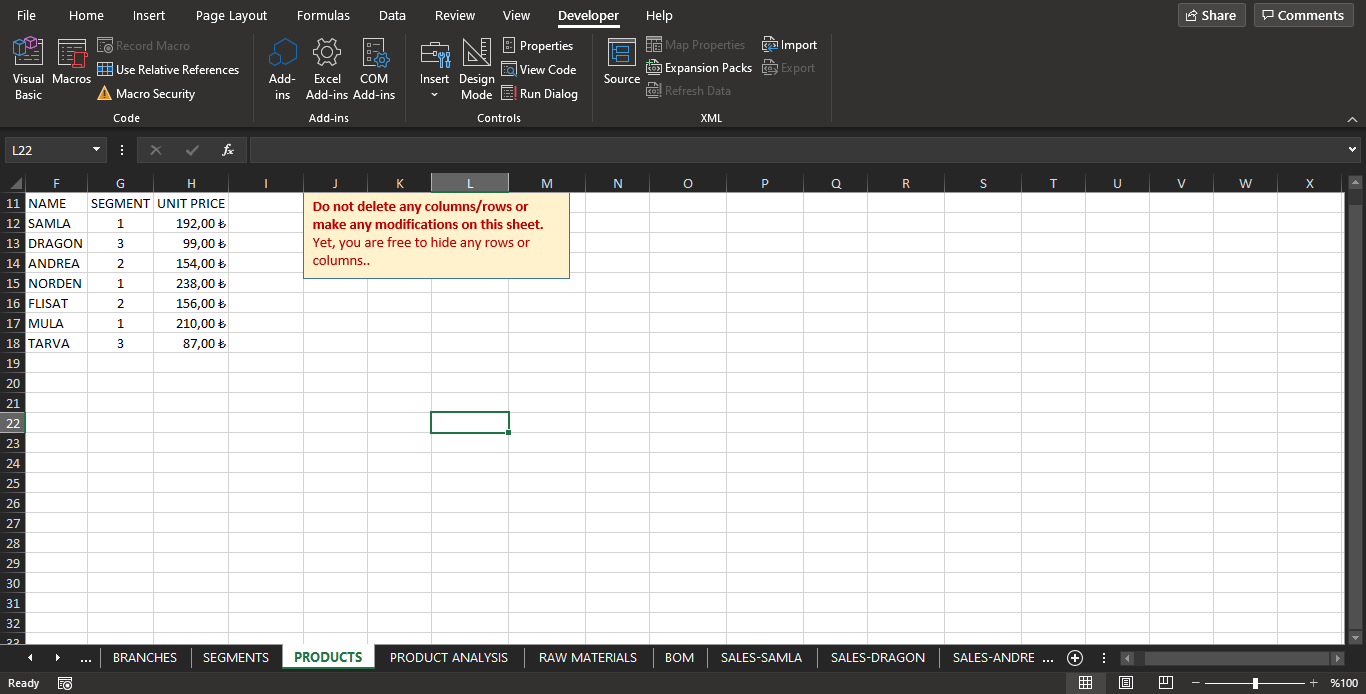
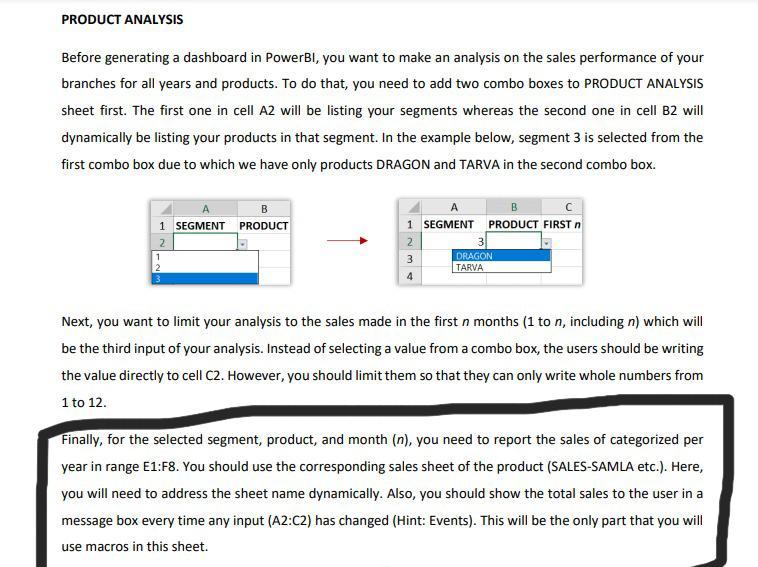
File Home Insert Page Layout Formulas Data Share Comments E Record Macro Use Relative References Visual Macros Basic A Macro Security N Review View Developer Help Properties e Map Properties Import View Code Expansion Packs @ Export Insert Design Source Mode El Run Dialog col Refresh Data Controls XML Add- ins 60 Excel COM Add-ins Add-ins Code Add-ins J19 X fic L R S T U V W X Y Z AA AB K 15 SEGMENT ID DESCRIPTION 16 1 PREMIUM 17 2 LUXURY 18 3 GENERAL M N O P Do not delete any columns/rows or make any modifications on this sheet. Yet, you are free to hide any rows or columns.. 19 20 21 22 23 24 25 26 27 28 29 30 31 32 33 34 35 36 27 BRANCHES SEGMENTS PRODUCTS PRODUCT ANALYSIS IEE RAW MATERIALS BOM SALES-SAMLA SALES-DRAGON SALES-ANDRE ... + Ready FO %100 % File Home Insert Page Layout Formulas Data Share Comments Record Macro Review View Developer Help e Map Properties Import a View Code Expansion Packs @ Export Insert Design Source Mode El Run Dialog Rol Refresh Data N E Properties 003 Use Relative References Visual Macros Basic A Macro Security Add- ins Excel COM Add-ins Add-ins Code Add-ins Controls XML L22 X N O Q R S T U W X F G H 11 NAME SEGMENT UNIT PRICE 12 SAMLA 1 192,00 13 DRAGON 3 99,00 6 14 ANDREA 2 154,00 15 NORDEN 1 238,00 16 FLISAT 2 156,00 17 MULA 1 210,00 18 TARVA 3 87,00 K M Do not delete any columns/rows or make any modifications on this sheet. Yet, you are free to hide any rows or columns.. 19 20 21 22 1 23 24 25 26 27 28 29 30 31 32 BRANCHES SEGMENTS PRODUCTS PRODUCT ANALYSIS RAW MATERIALS BOM SALES-SAMLA SALES-DRAGON SALES-ANDRE ... + Ready EO + %100 File Home Insert Page Layout Formulas Data Share Comments EO Record Macro E NT Properties Review View Developer Help E Map Properties Import View Code Expansion Packs Export Insert Design Source Mode El Run Dialog Rol Refresh Data Use Relative References Visual Macros Basic A Macro Security Add- ins 820 Excel COM Add-ins Add-ins v Code Add-ins Controls XML B2 foc NORDEN D G H I J K L L M N O P R S B 1 SEGMENT PRODUCT FIRST n MONTHS 2 1 NORDEN 2 3 E F F YEAR TOTAL SALES 2014 2015 4 2016 2017 2018 5 VLOOKUP TABLE 6 7 2019 2020 9 10 1 2 3 SAMLA ANDREA DRAGON NORDEN FLISAT TARVA MULA 11 12 13 14 15 16 17 18 19 20 21 22 22 BRANCHES SEGMENTS PRODUCTS PRODUCT ANALYSIS RAW MATERIALS BOM SALES-SAMLA SALES-DRAGON SALES-ANDRE ... + File Home Insert Page Layout Formulas Data Share Comments Review View Developer Help Properties E Map Properties Import View Code Expansion Packs @ Export Insert Design Source Mode El Run Dialog kol Refresh Data Controls XML Record Macro Use Relative References A Macro Security N Visual Macros Basic Add- ins Excel COM Add-ins Add-ins Code Add-ins K8 fic F K L M N O P R S T H J Do not delete any columns/rows or make any modifications on this sheet. Yet, you are free to hide any rows or columns.. A B D E 1 BRANCH UNITS SOLD DATE MONTH CUSTOMERID 2 AT003 202 21.01.2019 1 334 3 ES002 382 18.07.2020 7 7 4 ES003 466 21.07.2018 7 270 5 TR004 733 24.05.2020 5 234 6 ES003 535 8.09.2018 9 390 7 GB001 365 30.08.2017 8 86 8 GB003 560 17.09.2019 9 410 9 UA002 1324 9.04.2017 4 283 10 AT001 222 5.09.2020 9 149 11 TR006 486 14.11.2019 11 261 12 GB007 106 6.12.2018 12 62 13 GB004 458 22.06.2020 6 449 14 IT003 920 28.04.2019 4 61 15 NL005 470 6.12.2019 12 234 16 NL004 971 17.04.2019 4 339 17 IT005 477 5.05.2018 5 525 18 DE002 326 9.05.2019 5 197 19 ES006 294 3.01.2018 1 215 20 UA002 1375 14.02.2018 2 531 21 FR004 255 29.09.2018 9 123 22 TR001 1351 2.02.2019 2 203 22 761 27 11 2010 11 226 BRANCHES SEGMENTS PRODUCTS PRODUCT ANALYSIS RAW MATERIALS BOM SALES-SAMLA SALES-DRAGON SALES-ANDRE ... + Ready Eg 3 %100 PRODUCT ANALYSIS Before generating a dashboard in PowerBl, you want to make an analysis on the sales performance of your branches for all years and products. To do that, you need to add two combo boxes to PRODUCT ANALYSIS sheet first. The first one in cell A2 will be listing your segments whereas the second one in cell B2 will dynamically be listing your products in that segment. In the example below, segment 3 is selected from the first combo box due to which we have only products DRAGON and TARVA in the second combo box. B B 1 SEGMENT PRODUCT FIRST n 1 SEGMENT PRODUCT 2 1 2 2 3 4 3 DRAGON TARVA Next, you want to limit your analysis to the sales made in the first n months (1 to n, including n) which will be the third input of your analysis. Instead of selecting a value from a combo box, the users should be writing the value directly to cell C2. However, you should limit them so that they can only write whole numbers from 1 to 12. Finally, for the selected segment, product, and month (n), you need to report the sales of categorized per year in range E1:F8. You should use the corresponding sales sheet of the product (SALES-SAMLA etc.). Here, you will need to address the sheet name dynamically. Also, you should show the total sales to the user in a message box every time any input (A2:C2) has changed (Hint: Events). This will be the only part that you will use macros in this sheet
Step by Step Solution
There are 3 Steps involved in it

Get step-by-step solutions from verified subject matter experts