

Question: First, let's just see if the question responses are the same or different for each class. Load each class ( probably with a loop )
First, let's just see if the question responses are the same or different for each class. Load each class probably with a loop and use the different ANOVA tests ANOVA Alexander Govern, and Kurskal for all questions in each class. Do any of the classes
have significant results p
b In class we saw an example of including the discrete error correction for Welch's t test by using random trials for many test and averaging the resulting pvalues. Extend this to the ANOVA testing ANOVA Alexander Govern, and Kurskal trials. Then run the
responses for each class through. How do the new average pvalues compare to the pvalues from part a
c We'd also like to know if there are differences between classes. There's three ways I
cna think to do this. One would be to take all the responses to all the questions for each class and do and ANOVA for the classes. But the problem is the respones in each class aren't independant, so lumping them together isn't really valid. So don't do this. A second was is to treat the respones to each question as a data set so you have data sets and do a big ANOVA etc on all of them. Give this a try, using the methods in part a and b What results to you get?
d The third way would be to treat each question seperately and compare the classes for that question with an ANOA. Give this a try. What pvalues do you get for each question? And there any questions where at least one class gave a significantly different response?
e Really what were doing isn't totally valid anyway the reponses to the SPOT survey
aren't actually numbers, they're strongly agree, agree, etc. Really, a or is a "postive"
reponse and an or is a "negative" response, and a is "neutral". If we group
"postive" and "negative" repsones, and irgnore neutral respones which is not a great
idea we can treat the repsones as a binomial distribution. Doing this, we can estimate
how many respones we need in a class to get useful data. For example, how many
students would need to respond for you to be confident more students gave positive
respones than negative responses? You can calculate this using the Chernofftrials, if
you pick a good value for p delta, and epsilon. What might some good values be How many respones are needed for those values?
A onesided version of the Chernofftails calculation might actually be more useful
here, but don't worry about coming up with one for the homework.
f Based on your results, do you think the survey questions in SPOT contain much
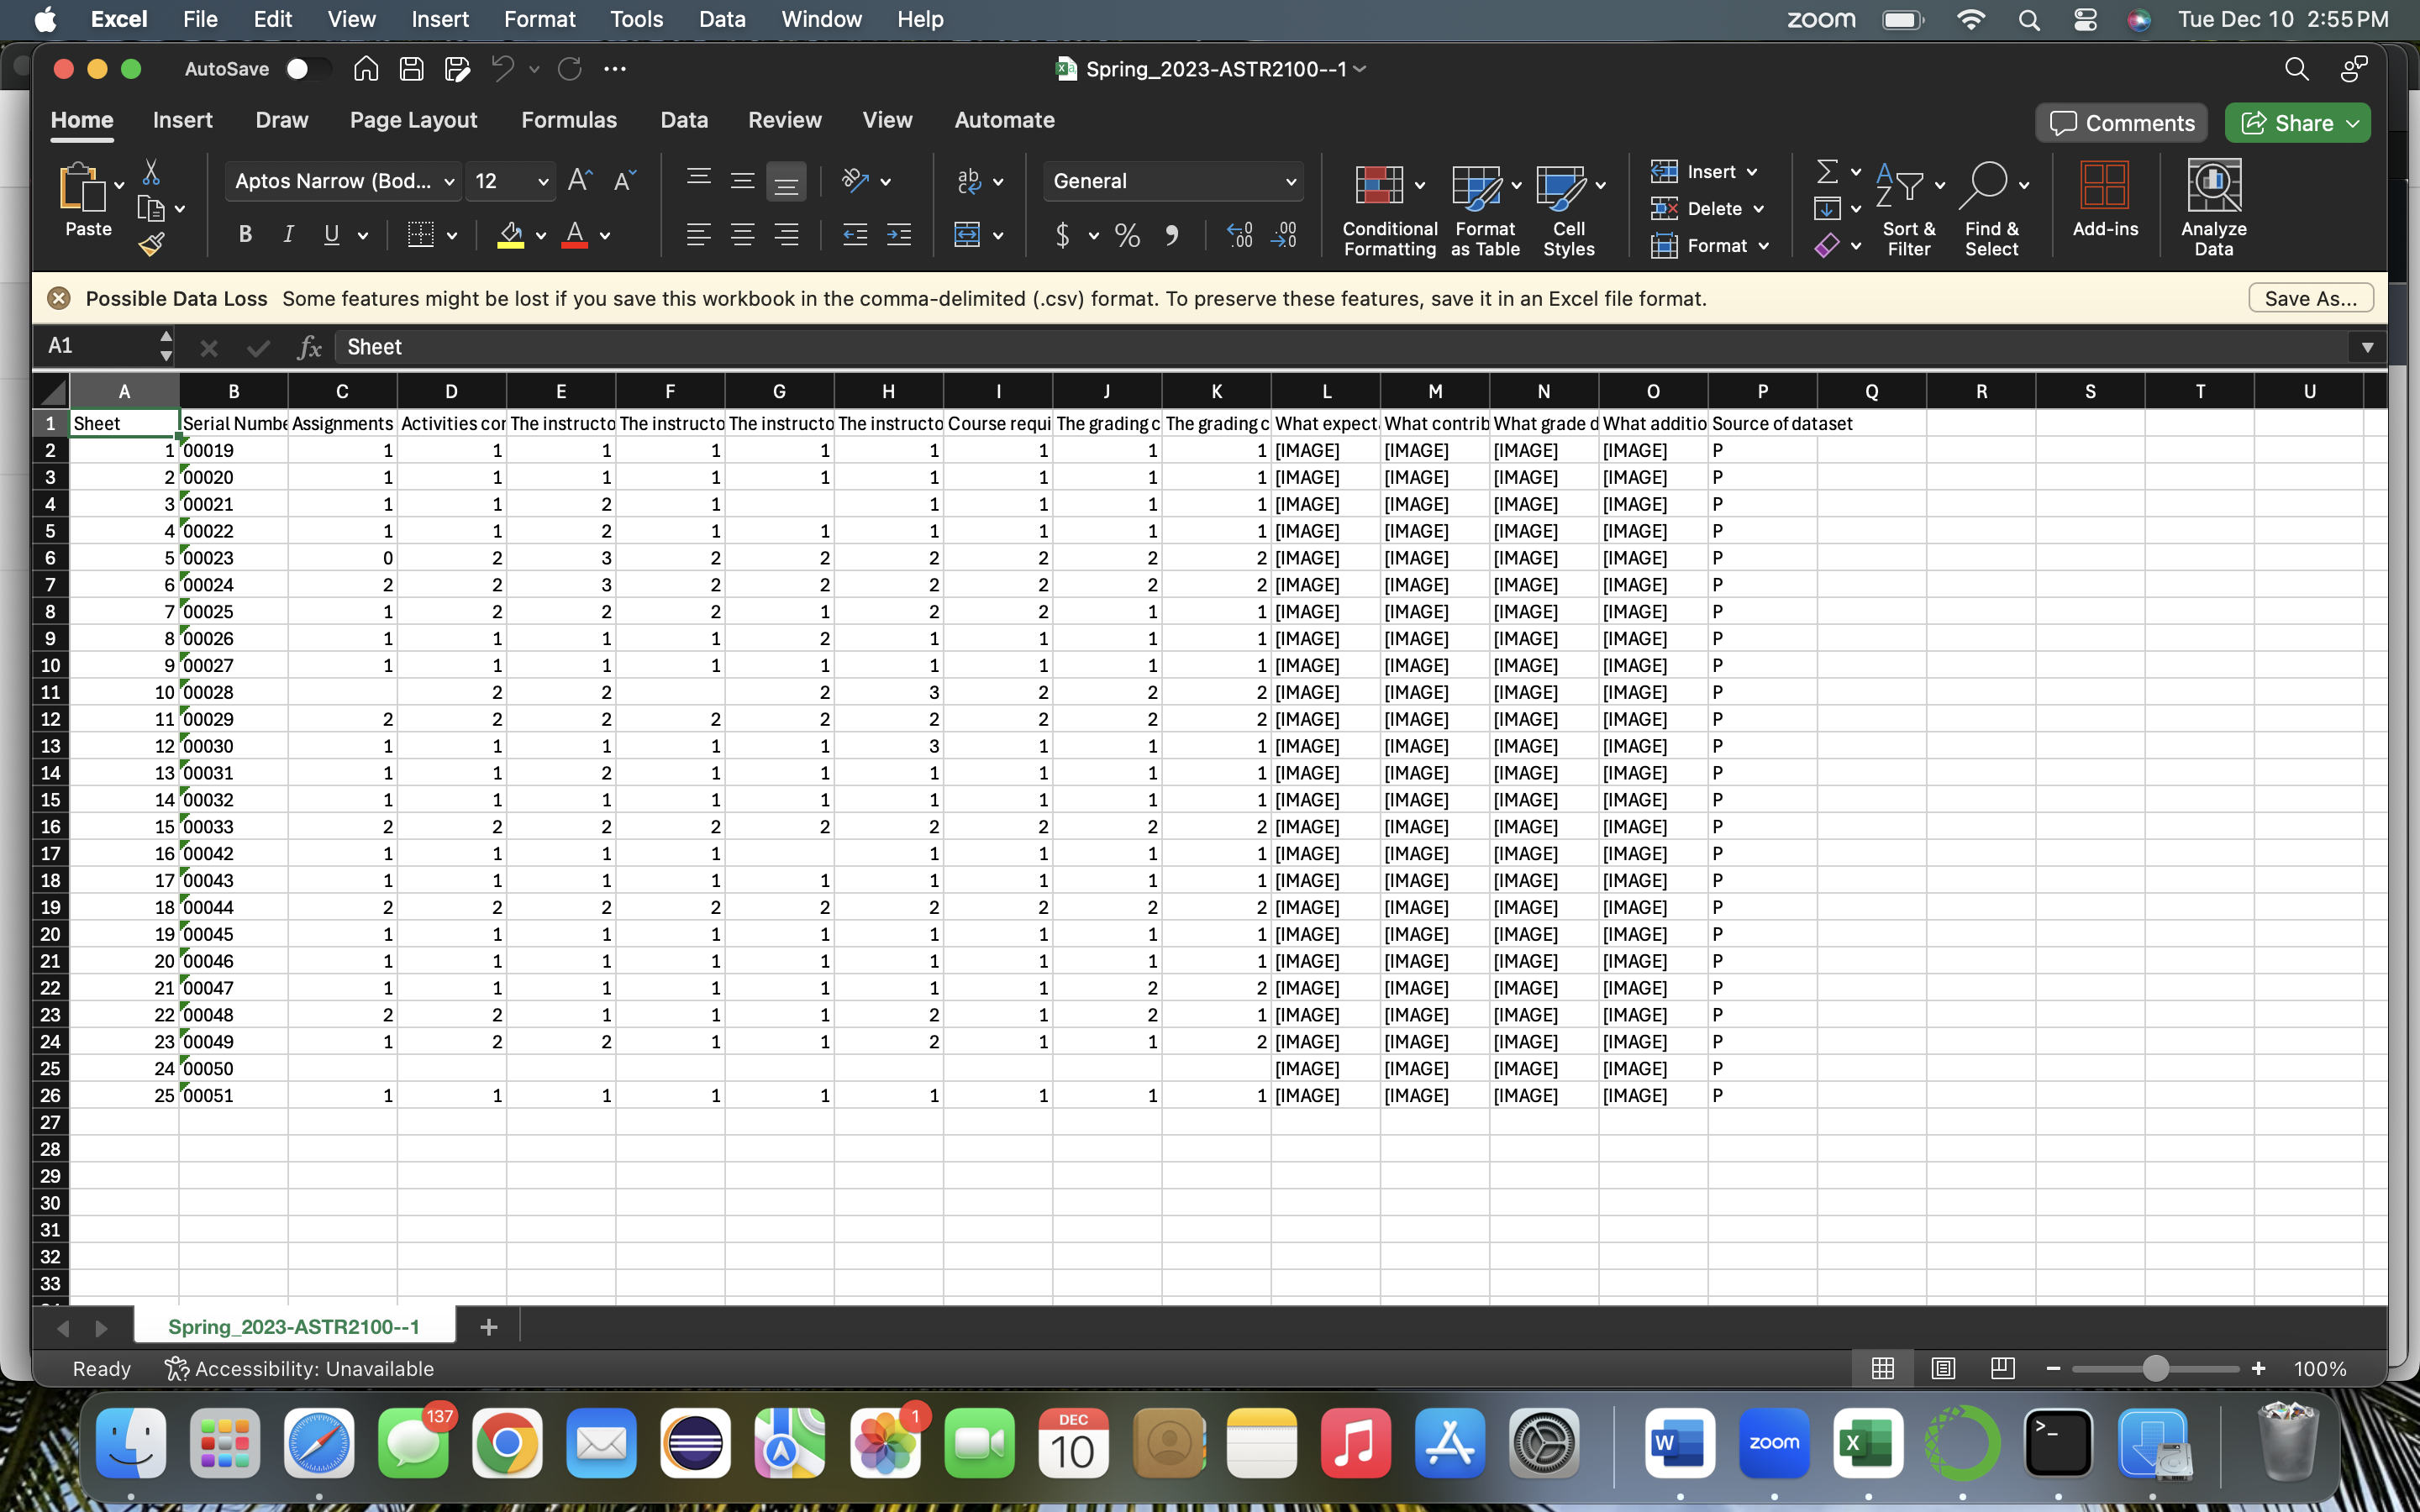
statistically valid information? Possible Data Loss Some features might be lost if you save this workbook in the commadelimited csv format. To preserve these features, save it in an Excel file format. Possible Data Loss Some features might be lost if you save this workbook in the commadelimited csv format. To preserve these features, save it in an Excel file format. Possible Data Loss Some features might be lost if you save this workbook in the commadelimited csv format. To preserve these features, save it in an Excel file format.
Step by Step Solution
There are 3 Steps involved in it
1 Expert Approved Answer
Step: 1 Unlock

Question Has Been Solved by an Expert!
Get step-by-step solutions from verified subject matter experts
Step: 2 Unlock
Step: 3 Unlock