

Question: first part please Consider this time series data, showing the monthly number of airline miles flowin in the United Kingdom from Jan 1964 to Dec
first part please
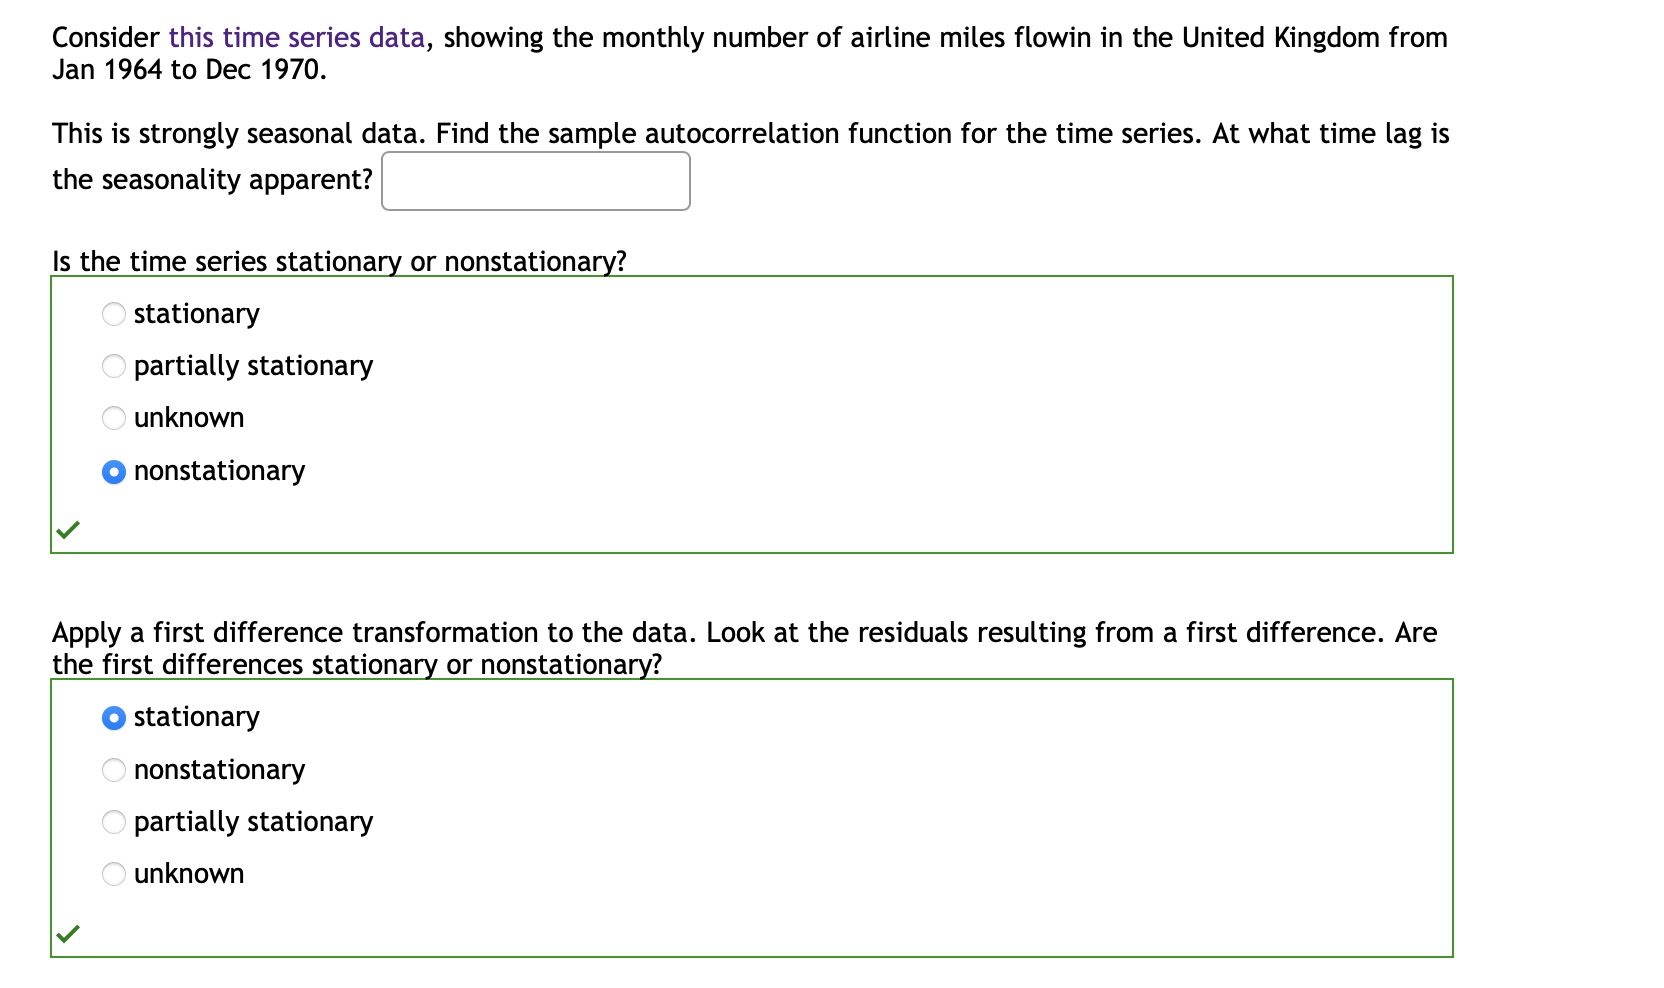
Consider this time series data, showing the monthly number of airline miles flowin in the United Kingdom from Jan 1964 to Dec 1970. This is strongly seasonal data. Find the sample autocorrelation function for the time series. At what time lag is the seasonality apparent? :] Is the time series stationa or nonstationa ? stationary partially stationary unknown 0 nonstationary Apply a first difference transformation to the data. Look at the residuals resulting from a first difference. Are the first differences stationary or nonstationary? O stationary nonstationary partially stationary unknown
Step by Step Solution
There are 3 Steps involved in it
1 Expert Approved Answer
Step: 1 Unlock

Question Has Been Solved by an Expert!
Get step-by-step solutions from verified subject matter experts
Step: 2 Unlock
Step: 3 Unlock