

Question: first photo has info needed to answer questions. please answer questions shown in second photo and third photo. organize answers/paper according to the third photo
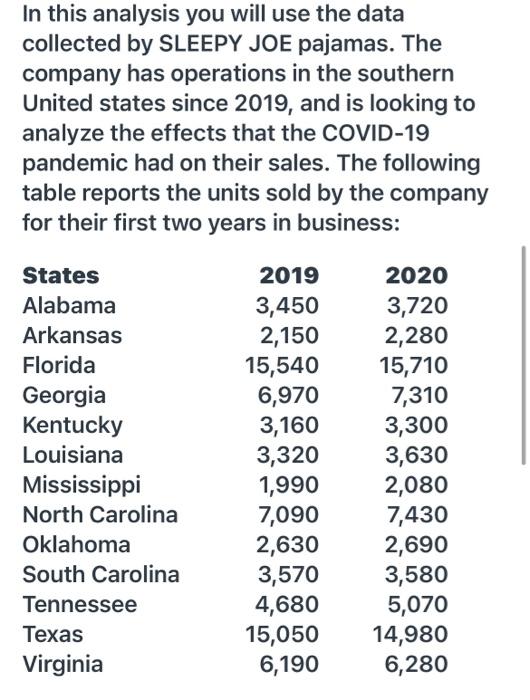
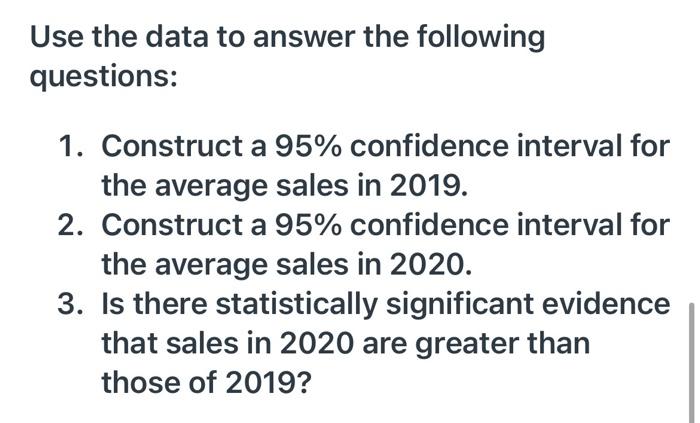
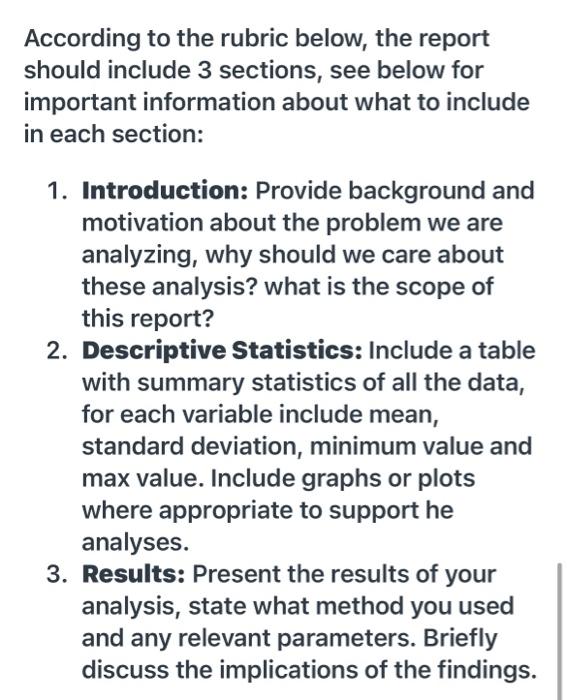
In this analysis you will use the data collected by SLEEPY JOE pajamas. The company has operations in the southern United states since 2019, and is looking to analyze the effects that the COVID-19 pandemic had on their sales. The following table reports the units sold by the company for their first two years in business: States Alabama Arkansas Florida Georgia Kentucky Louisiana Mississippi North Carolina Oklahoma South Carolina Tennessee Texas Virginia 2019 3,450 2,150 15,540 6,970 3,160 3,320 1,990 7,090 2,630 3,570 4,680 15,050 6,190 2020 3,720 2,280 15,710 7,310 3,300 3,630 2,080 7,430 2,690 3,580 5,070 14,980 6,280 Use the data to answer the following questions: 1. Construct a 95% confidence interval for the average sales in 2019. 2. Construct a 95% confidence interval for the average sales in 2020. 3. Is there statistically significant evidence that sales in 2020 are greater than those of 2019? According to the rubric below, the report should include 3 sections, see below for important information about what to include in each section: 1. Introduction: Provide background and motivation about the problem we are analyzing, why should we care about these analysis? what is the scope of this report? 2. Descriptive Statistics: Include a table with summary statistics of all the data, for each variable include mean, standard deviation, minimum value and max value. Include graphs or plots where appropriate to support he analyses. 3. Results: Present the results of your analysis, state what method you used and any relevant parameters. Briefly discuss the implications of the findings
Step by Step Solution
There are 3 Steps involved in it

Get step-by-step solutions from verified subject matter experts