

Question: First problem set please ask if any questions/concerns. ECN 140 Quantitative Economic Analysis B. Rosario Due: 2/3/2016 HW 1 1) Each cell below records the
First problem set please ask if any questions/concerns.
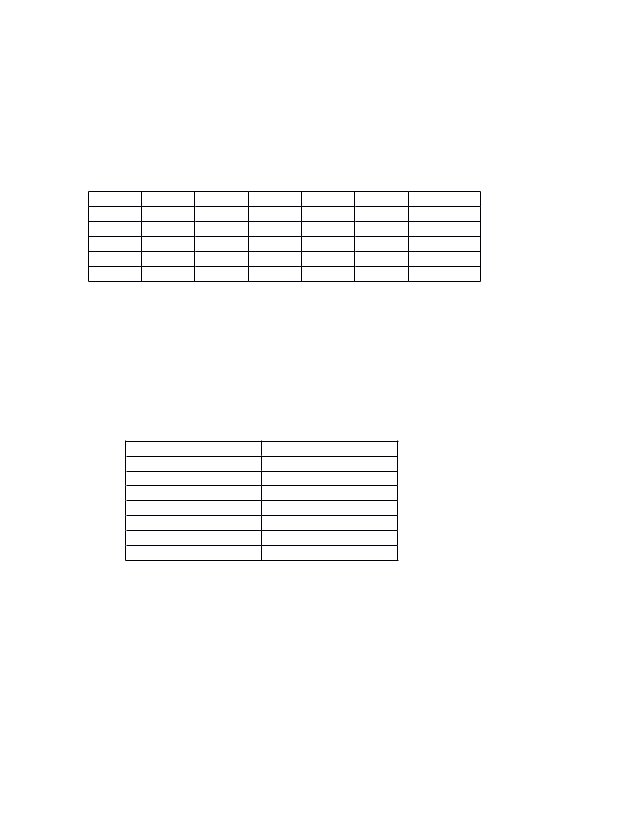
ECN 140 Quantitative Economic Analysis B. Rosario Due: 2/3/2016 HW 1 1) Each cell below records the income of a household in our sample. 27,500 31,530 68,250 60,512 45,863 22,256 13,952 115,265 85,426 56,895 32,598 26,895 11,256 8,251 97,265 61,256 21,587 84,587 81,025 95,265 22,478 37,556 99,874 75,412 90,256 92,013 51,264 6,235 4,568 94,526 62,584 80,147 75,123 44,589 28,569 17,552 31,520 14,587 8,542 84,203 51,478 34,256 a) With BIN/ income intervals of $10,000 (i.e., 0-10,000, 10,001-20,000, etc.), use excel construct a histogram for the income data listed above. Let the income intervals be on the x axis and the income frequency be on the y-axis. Not using Excel: b) Calculate the mean of the observations on the first row. Show your work. c) Calculate the variance of the observations on the first row. Show your work. d) Using the table below, calculate the covariance between x and y. x 3 6 8 5 9 5 9 y 1 3 5 7 8 9 12
Step by Step Solution
There are 3 Steps involved in it

Get step-by-step solutions from verified subject matter experts