

Question: First run a moving average model using the revenue data. a.State the moving average period you picked and briefly discuss whether you think the model
First run a moving average model using the revenue data.
a.State the moving average period you picked and briefly discuss whether you think the model can do a good job forecasting and why.
Simple exponential smoothing
a.State the reason for your choice of the smoothing model and run the model. Make sure to store the residuals.
d.Show the resulting graph from the smoothing method. State the model you picked and the parameter values such as ?, ?, ?, if any.
c.Examine the residuals using time series plot and ACF graph. Do you observe any significant autocorrelation?
d.Briefly discuss whether you think the model can do a good job forecasting and why.
*Date /Revenue Chart*
1990-03-303019.0
1990-06-293076.0
1990-09-283099.0
1990-12-313105.0
1991-03-292996.0
1991-06-283081.0
1991-09-303104.0
1991-12-313099.0
1992-03-313019.0
1992-06-303149.0
1992-09-303167.0
1992-12-313254.0
1993-03-313163.0
1993-06-303220.0
1993-09-303290.0
1993-12-313317.0
1994-03-313373.0
1994-06-303394.0
1994-09-303415.0
1994-12-303609.0
1995-03-313450.0
1995-06-303564.0
1995-09-293261.0
1995-12-293265.0
1996-03-313208.0
1996-06-303224.0
1996-09-307377.0
1996-12-317405.0
1997-03-317416.0
1997-06-307708.0
1997-09-307374.0
1997-12-317696.0
1998-03-317651.0
1998-06-307928.0
1998-09-307910.0
1998-12-318077.0
1999-03-317967.0
1999-06-3014510.0
1999-09-3014660.0
1999-12-3115260.0
2000-03-3114530.0
2000-06-3016770.0
2000-09-3016530.0
2000-12-3116870.0
2001-03-3116270.0
2001-06-3016910.0
2001-09-3017000.0
2001-12-3117010.0
2002-03-3116430.0
2002-06-3016750.0
2002-09-3017110.0
2002-12-3116910.0
2003-03-3116490.0
2003-06-3016830.0
2003-09-3017060.0
2003-12-3117200.0
2004-03-3117060.0
2004-06-3017760.0
2004-09-3018210.0
2004-12-3112730.0
2005-03-3118180.0
2005-06-3018050.0
2005-09-3018490.0
2005-12-3115300.0
2006-03-3121230.0
2006-06-3021890.0
2006-09-3022460.0
2006-12-3122610.0
2007-03-3122580.0
2007-06-3023270.0
2007-09-3023770.0
2007-12-3123840.0
2008-03-3123830.0
2008-06-3024120.0
2008-09-3024750.0
2008-12-3124640.0
2009-03-3126590.0
2009-06-3026860.0
2009-09-3027260.0
2009-12-3127090.0
2010-03-3126910.0
2010-06-3026770.0
2010-09-3026480.0
2010-12-3126400.0
2011-03-3126990.0
2011-06-3027540.0
2011-09-3027910.0
2011-12-3128440.0
2012-03-3128240.0
2012-06-3028550.0
2012-09-3029010.0
2012-12-3130040.0
2013-03-3129420.0
2013-06-3029790.0
2013-09-3030280.0
2013-12-3131060.0
2014-03-3130820.0
2014-06-3031480.0
2014-09-3031590.0
2014-12-3133190.0
2015-03-3131980.0
2015-06-3032220.0
2015-09-3033160.0
2015-12-3134250.0
2016-03-3132170.0
2016-06-3030530.0
2016-09-3030940.0
2016-12-3132340.0
2017-03-3129810.0
2017-06-3030550.0
2017-09-3031720.0
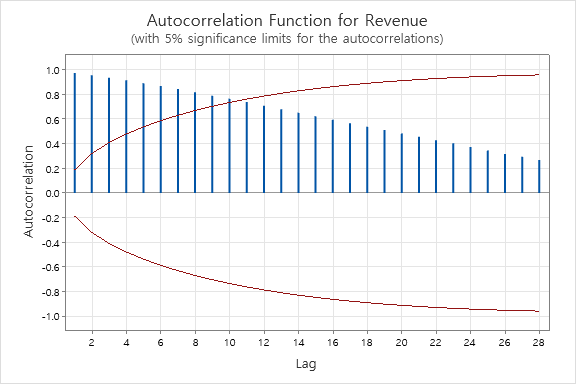
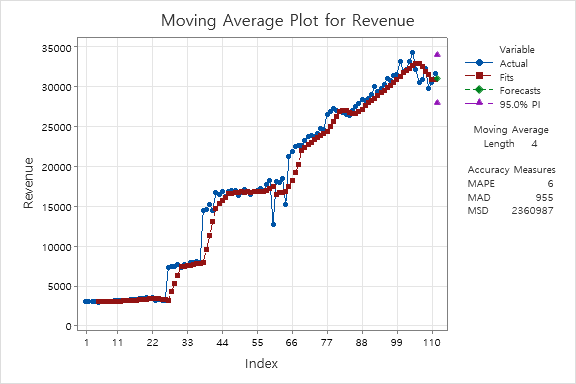
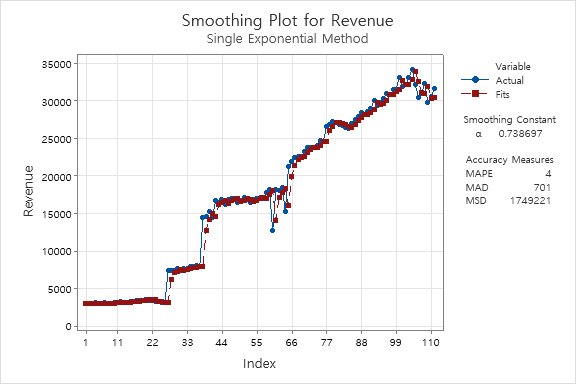
Autocorrelation Function for Revenue (with 5% significance limits for the autocorrelations) 1.0 D.8 0.6 0.4 0.2 Autocorrelation 0.0 -0.2 -0.4 -0.6 -0.8 -1.0 2 6 8 10 12 14 16 18 20 22 24 26 28 LagMoving Average Plot for Revenue 35000 Variable Actual Fits 30000 Forecasts 95.0% PI 25000 Moving Average Length 4 20000 Accuracy Measures Revenue MAPE 6 MAD 955 15000 MSD 2360987 10000 5000 O 1 11 22 33 44 55 66 77 88 99 110 IndexSmoothing Plot for Revenue Single Exponential Method 35000 Variable Actual 30000 Fits Smoothing Constant 25000 a 0.738697 Accuracy Measures 20000 MAPE 4 Revenue MAD 701 MSD 1749221 15000 10000 5000 1 11 22 33 44 55 66 77 88 99 110 Index35000 30000 25000 Revenue 20000 15000 10000 Time Series Plot of Revenue 5000 1990-03-30 1992-09-30 1995-06-30 1998-03-31 2000-12-31 2003-09-30 2006-06-30 Date 2009-03-31 2011-12-31 2014-09-30 2017-06-30
Step by Step Solution
There are 3 Steps involved in it

Get step-by-step solutions from verified subject matter experts