

Question: fIs this the correct scatter plot? Scatterplot of Graduation Rate by Acceptance Rate 120 100 80 Graduation Rate 60 40 20 10 15 20 25
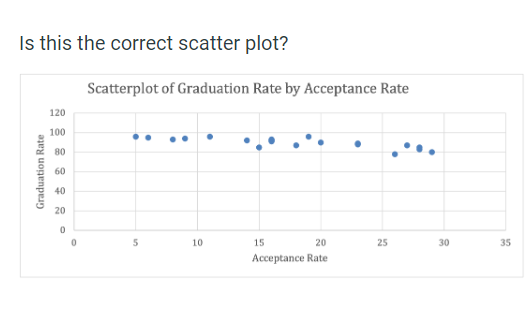
\fIs this the correct scatter plot? Scatterplot of Graduation Rate by Acceptance Rate 120 100 80 Graduation Rate 60 40 20 10 15 20 25 30 35 Acceptance Rate
Step by Step Solution
There are 3 Steps involved in it
1 Expert Approved Answer
Step: 1 Unlock

Question Has Been Solved by an Expert!
Get step-by-step solutions from verified subject matter experts
Step: 2 Unlock
Step: 3 Unlock