

Question: Fisher's (1936) iris data set provides the measurements in centimeters of the variables sepal length and width and petal length and width, respectively, for
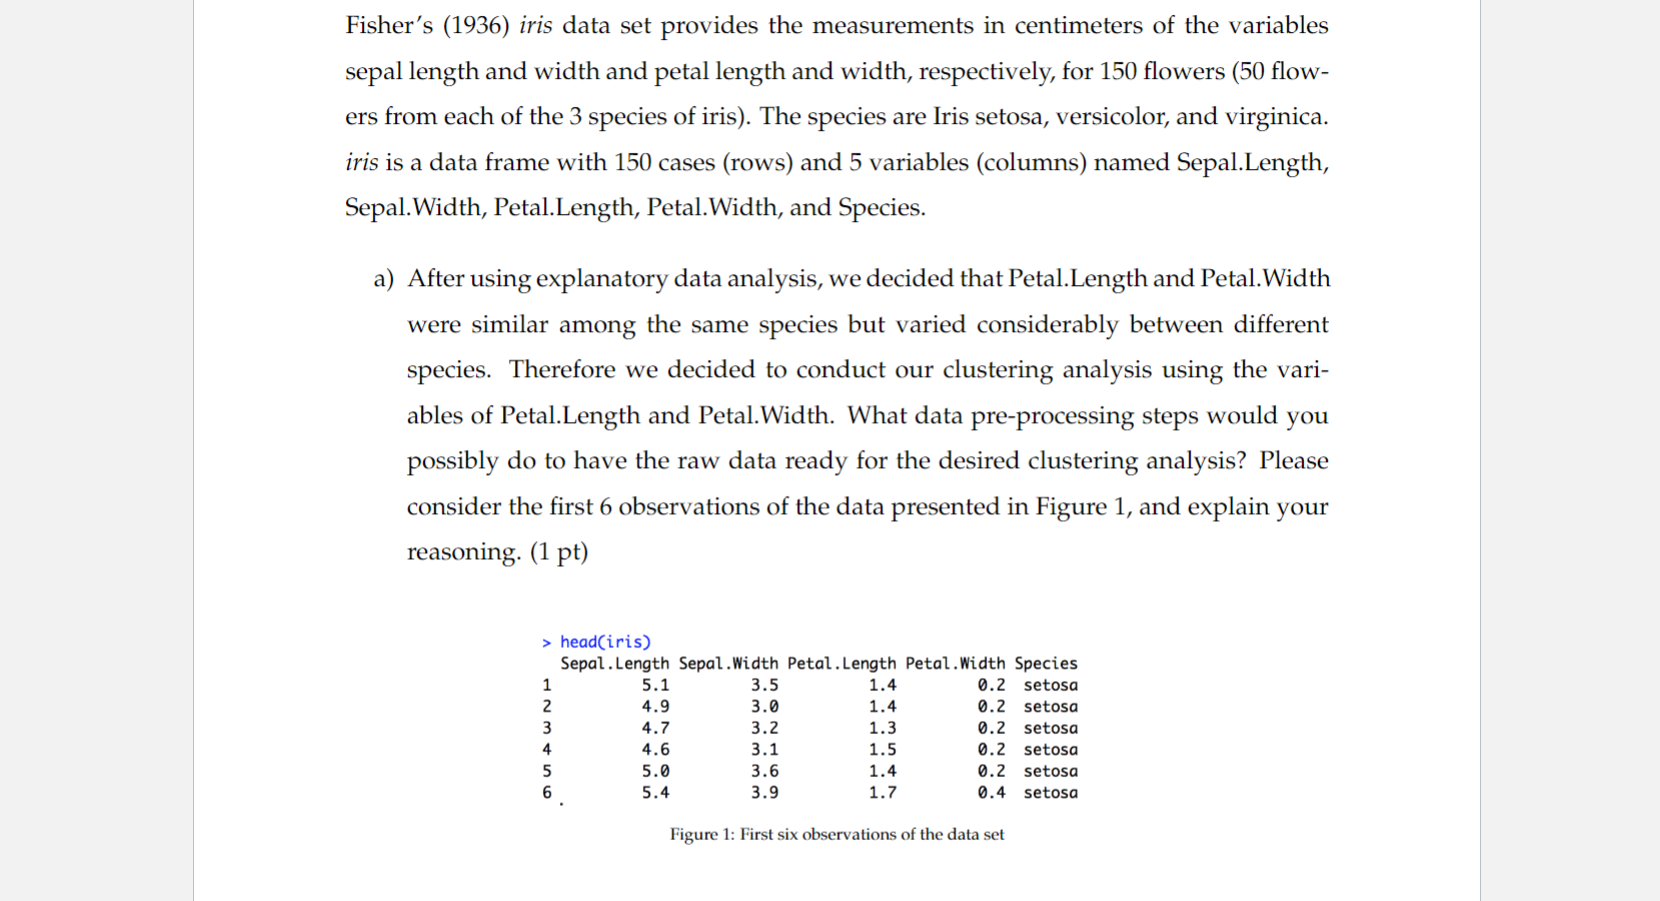
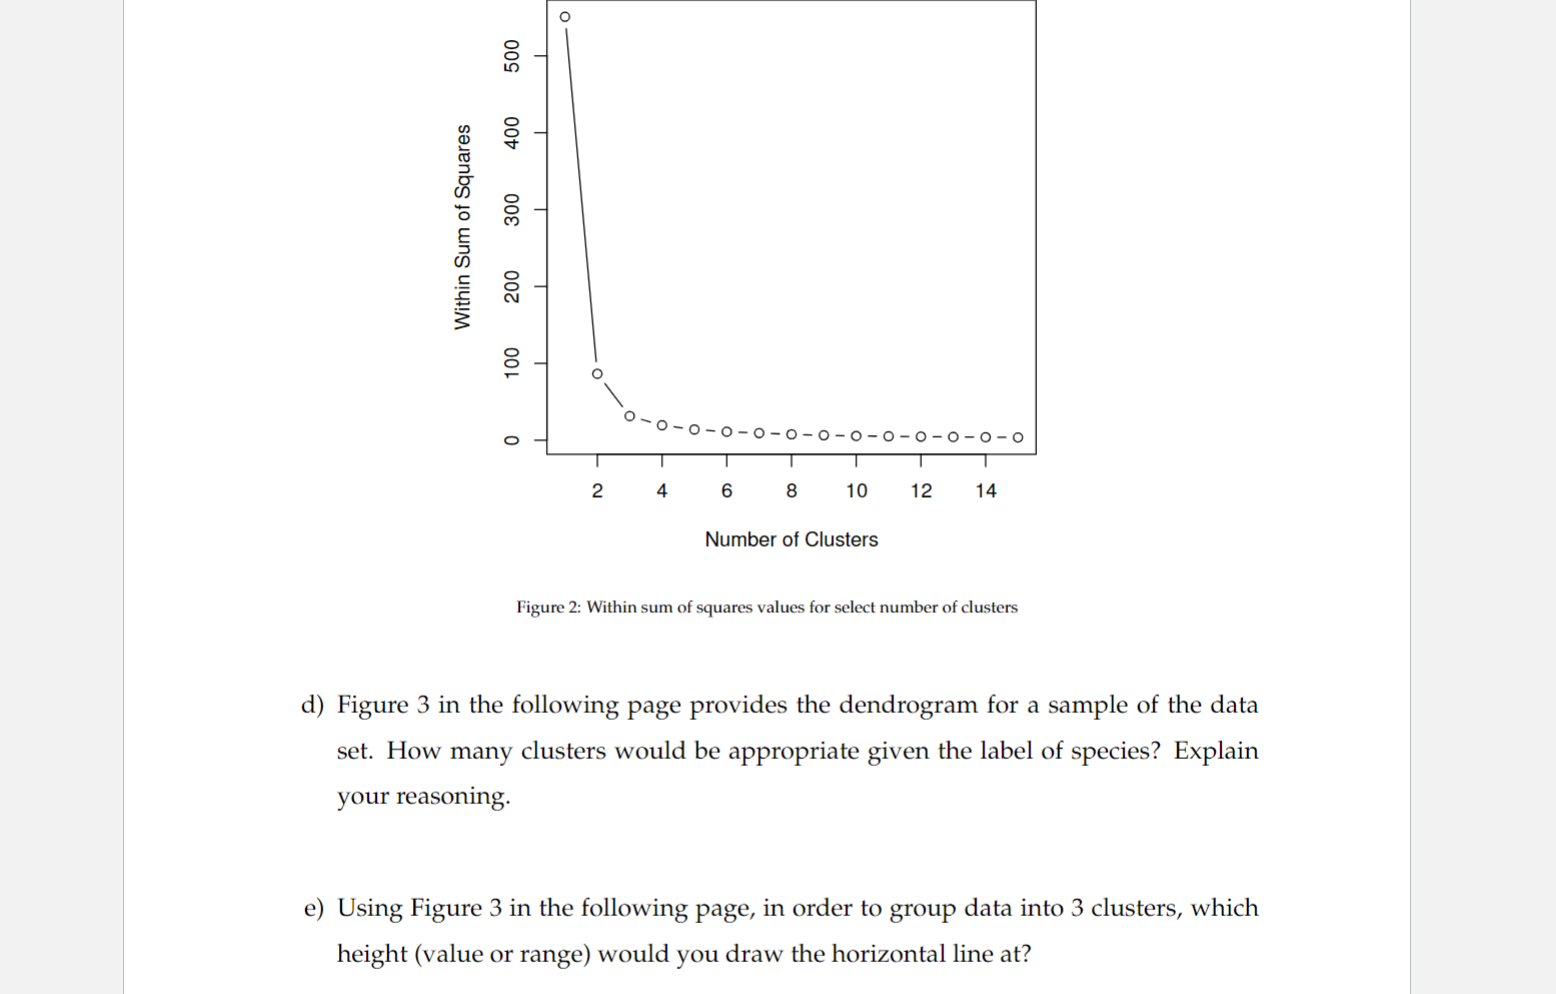
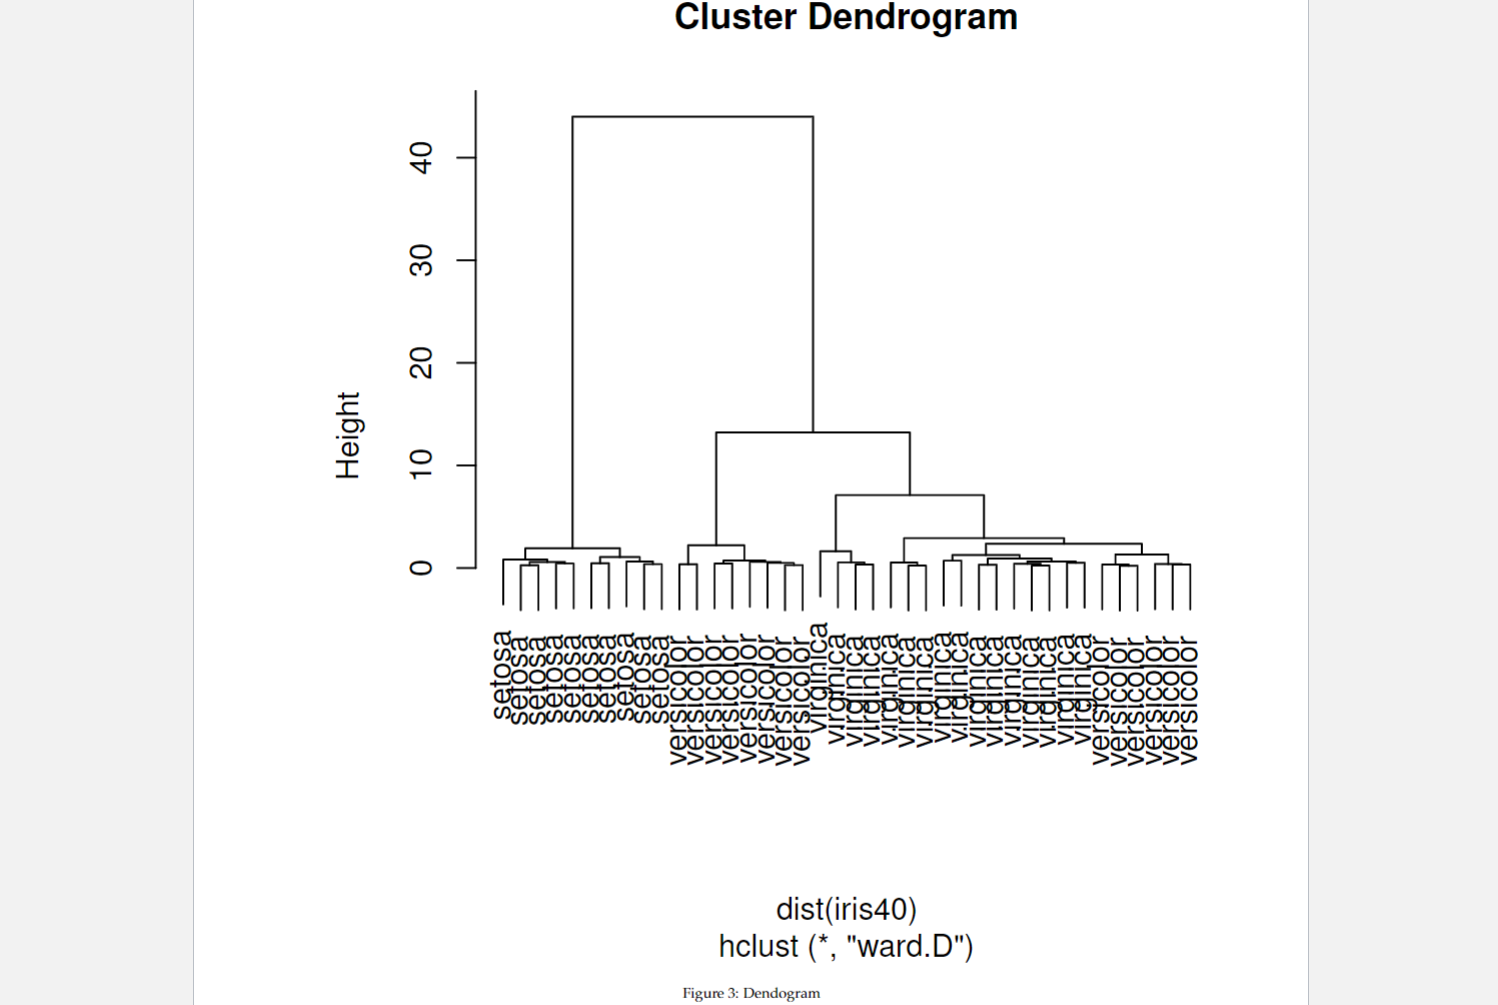
Fisher's (1936) iris data set provides the measurements in centimeters of the variables sepal length and width and petal length and width, respectively, for 150 flowers (50 flow- ers from each of the 3 species of iris). The species are Iris setosa, versicolor, and virginica. iris is a data frame with 150 cases (rows) and 5 variables (columns) named Sepal.Length, Sepal.Width, Petal.Length, Petal.Width, and Species. a) After using explanatory data analysis, we decided that Petal.Length and Petal.Width were similar among the same species but varied considerably between different species. Therefore we decided to conduct our clustering analysis using the vari- ables of Petal.Length and Petal.Width. What data pre-processing steps would you possibly do to have the raw data ready for the desired clustering analysis? Please consider the first 6 observations of the data presented in Figure 1, and explain your reasoning. (1 pt) > head(iris) Sepal.Length Sepal.Width Petal.Length Petal.Width Species 0.2 setosa 0.2 setosa 0.2 setosa 0.2 setosa 0.2 setosa 0.4 setosa 1 2 3 4 5 6 5.1 4.9 4.7 4.6 5.0 5.4 3.5 3.0 3.2 3.1 3.6 3.9 1.4 1.4 1.3 1.5 1.4 1.7 Figure 1: First six observations of the data set b) Figure 2 was retrieved by utilizing k-means clustering analysis using 25 randomly selected starting points. It provides the within sum of squares values for select number of clusters. Using this output and elbow method, determine the number of clusters and explain your reasoning. (1 pt) c) For a given number of clusters, the ratio of between sum of squares and total sum of squares is 94.3 percent. What does this value mean with respect to the quality of clustering?) 500 400 300 Within Sum of Squares 200 100 0 2 4 6 8 -0-0-0-0-0-0-0 10 Number of Clusters 12 14 Figure 2: Within sum of squares values for select number of clusters d) Figure 3 in the following page provides the dendrogram for a sample of the data set. How many clusters would be appropriate given the label of species? Explain your reasoning. e) Using Figure 3 in the following page, in order to group data into 3 clusters, which height (value or range) would you draw the horizontal line at? C D C D C D C D C D CD. Figure 3: Dendogram hclust (*, "ward.D") dist(iris40) DDDDDDDD Cluster Dendrogram 0 10 20 30 40 Height
Step by Step Solution
3.44 Rating (147 Votes )
There are 3 Steps involved in it
Explanations a Based on the information provided in the image the data preprocessing steps I would recommend for conducting the desired clustering analysis using the variables PetalLength and PetalWid... View full answer

Get step-by-step solutions from verified subject matter experts