

Question: FIT ANALYSIS Table 6.4 Cost-Benefit Analysis for Two Public Infrastructure Projects ($) Cost Year Personnel Operating Capital Berrefit 0 300,000 150,000 100,000 Project A 0
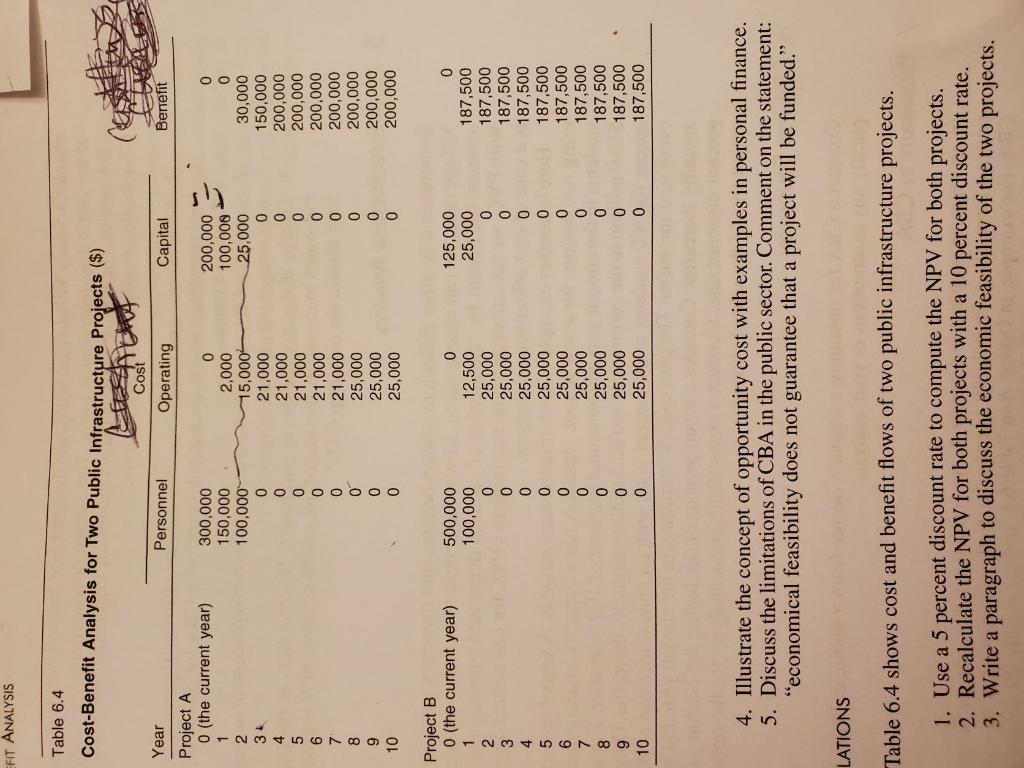
FIT ANALYSIS Table 6.4 Cost-Benefit Analysis for Two Public Infrastructure Projects ($) Cost Year Personnel Operating Capital Berrefit 0 300,000 150,000 100,000 Project A 0 (the current year) 1 2 34 4 5 6 0 2,000 15,0004 21,000 21,000 21,000 21,000 21,000 25,000 25,000 25,000 200,000 100,000 25,000 0 0 0 0 0 0 0 0 30,000 150,000 200,000 200,000 200,000 200,000 200,000 0 8 9 10 200,000 200,000 Project B 0 (the current year) 1 2 3 4 5 6 7 8 9 10 500,000 100,000 0 0 0 0 0 0 0 0 0 0 12,500 25,000 25,000 25,000 25,000 25,000 25,000 25,000 25,000 25,000 125,000 0 25,000 187,500 0 187,500 0 187,500 0 187,500 0 187,500 0 187,500 0 187,500 0 187,500 0 187,500 0 187,500 . 4. Illustrate the concept of opportunity cost with examples in personal finance. 5. Discuss the limitations of CBA in the public sector. Comment on the statement: "economical feasibility does not guarantee that a project will be funded." LATIONS Table 6.4 shows cost and benefit flows of two public infrastructure projects. 1. Use a 5 percent discount rate to compute the NPV for both projects. 2. Recalculate the NPV for both projects with a 10 percent discount rate. 3. Write a paragraph to discuss the economic feasibility of the two projects. FIT ANALYSIS Table 6.4 Cost-Benefit Analysis for Two Public Infrastructure Projects ($) Cost Year Personnel Operating Capital Berrefit 0 300,000 150,000 100,000 Project A 0 (the current year) 1 2 34 4 5 6 0 2,000 15,0004 21,000 21,000 21,000 21,000 21,000 25,000 25,000 25,000 200,000 100,000 25,000 0 0 0 0 0 0 0 0 30,000 150,000 200,000 200,000 200,000 200,000 200,000 0 8 9 10 200,000 200,000 Project B 0 (the current year) 1 2 3 4 5 6 7 8 9 10 500,000 100,000 0 0 0 0 0 0 0 0 0 0 12,500 25,000 25,000 25,000 25,000 25,000 25,000 25,000 25,000 25,000 125,000 0 25,000 187,500 0 187,500 0 187,500 0 187,500 0 187,500 0 187,500 0 187,500 0 187,500 0 187,500 0 187,500 . 4. Illustrate the concept of opportunity cost with examples in personal finance. 5. Discuss the limitations of CBA in the public sector. Comment on the statement: "economical feasibility does not guarantee that a project will be funded." LATIONS Table 6.4 shows cost and benefit flows of two public infrastructure projects. 1. Use a 5 percent discount rate to compute the NPV for both projects. 2. Recalculate the NPV for both projects with a 10 percent discount rate. 3. Write a paragraph to discuss the economic feasibility of the two projects
Step by Step Solution
There are 3 Steps involved in it

Get step-by-step solutions from verified subject matter experts