

Question: Fit the brass middle material, using the heat transfer paste (reminder All the heat source and the heater sink middle parts is constructed of the
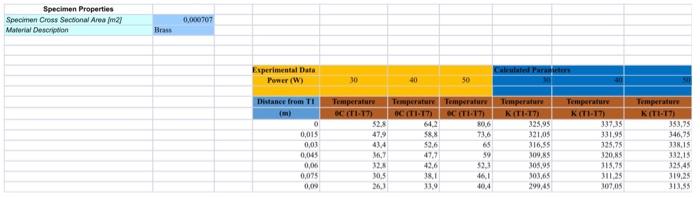
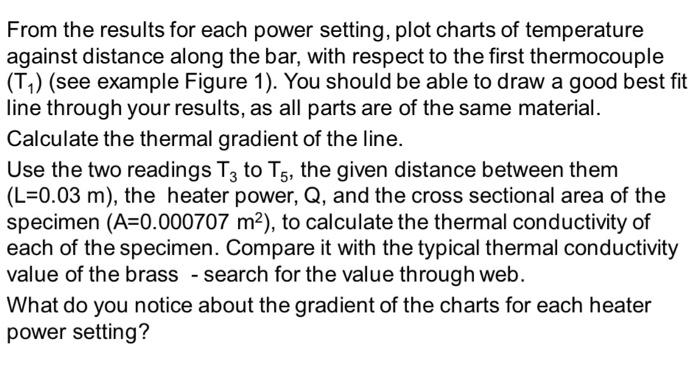
Specimen Properties Specimen Cross Sectional Area (m2) Material Desordion 0.000707 Brass Experimental Data Power (W) 50 Distance from TI () 0 0,015 Temperature C:17 Temperatur KT1-17) $23 47.9 0:03 Temperatur Temperature OCTI:17 CT17) 642 588 736 65 47,7 59 42.6 59 46.1 11,9 404 27 Temperature KT1-17 325,95 321.05 316.55 309,05 305,95 0765 299,45 Temperature K(T-17) 353,75 346,75 138,15 132.15 125.45 319.25 31335 0,045 0,06 331.95 325,75 320,NS 315,95 311,25 307,05 M. 123 10.5 26,1 O, From the results for each power setting, plot charts of temperature against distance along the bar, with respect to the first thermocouple (T1) (see example Figure 1). You should be able to draw a good best fit line through your results, as all parts are of the same material. Calculate the thermal gradient of the line. Use the two readings Tz to T5, the given distance between them (L=0.03 m), the heater power, Q, and the cross sectional area of the specimen (A=0.000707 m2), to calculate the thermal conductivity of each of the specimen. Compare it with the typical thermal conductivity value of the brass - search for the value through web. What do you notice about the gradient of the charts for each heater power setting? Specimen Properties Specimen Cross Sectional Area (m2) Material Desordion 0.000707 Brass Experimental Data Power (W) 50 Distance from TI () 0 0,015 Temperature C:17 Temperatur KT1-17) $23 47.9 0:03 Temperatur Temperature OCTI:17 CT17) 642 588 736 65 47,7 59 42.6 59 46.1 11,9 404 27 Temperature KT1-17 325,95 321.05 316.55 309,05 305,95 0765 299,45 Temperature K(T-17) 353,75 346,75 138,15 132.15 125.45 319.25 31335 0,045 0,06 331.95 325,75 320,NS 315,95 311,25 307,05 M. 123 10.5 26,1 O, From the results for each power setting, plot charts of temperature against distance along the bar, with respect to the first thermocouple (T1) (see example Figure 1). You should be able to draw a good best fit line through your results, as all parts are of the same material. Calculate the thermal gradient of the line. Use the two readings Tz to T5, the given distance between them (L=0.03 m), the heater power, Q, and the cross sectional area of the specimen (A=0.000707 m2), to calculate the thermal conductivity of each of the specimen. Compare it with the typical thermal conductivity value of the brass - search for the value through web. What do you notice about the gradient of the charts for each heater power setting
Step by Step Solution
There are 3 Steps involved in it

Get step-by-step solutions from verified subject matter experts