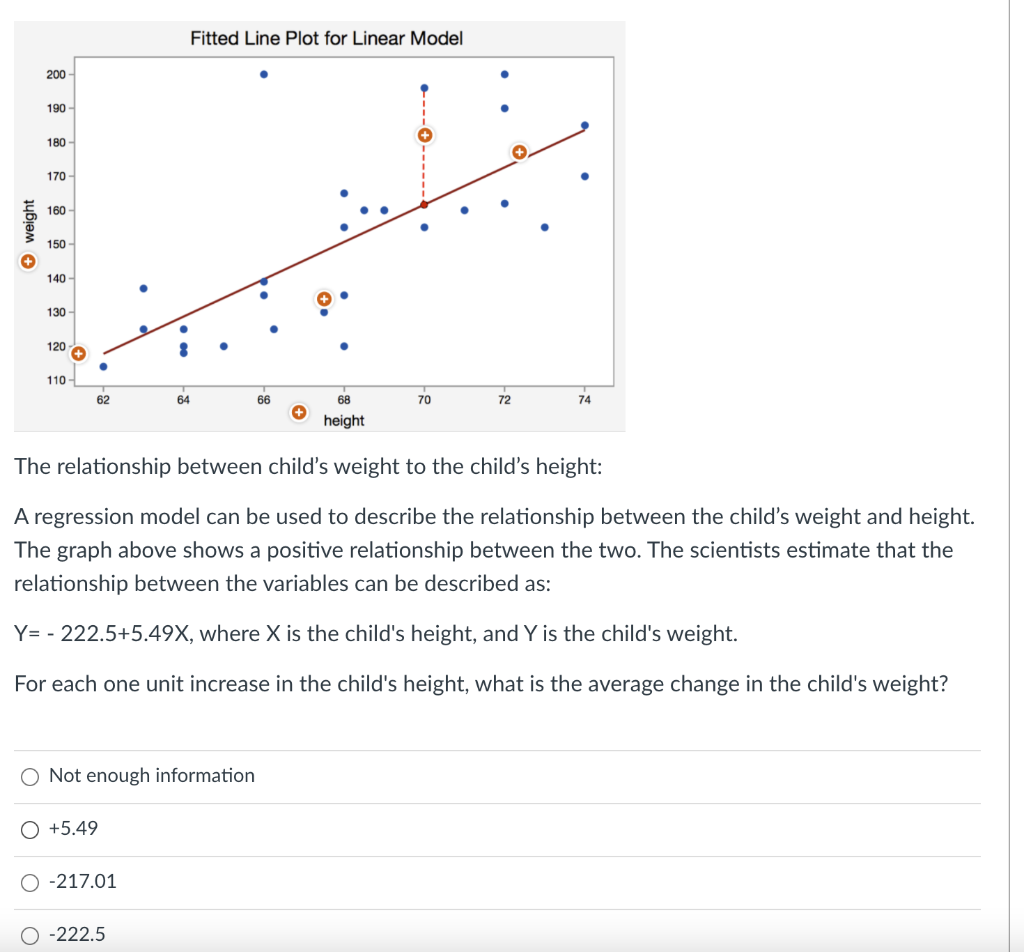
Question: Fitted Line Plot for Linear Model 200 190 180 170 160 weight 150 + 140 130 120 110 62 64 66 70 72 74 +

Fitted Line Plot for Linear Model 200 190 180 170

Fitted Line Plot for Linear Model 200 190 180 170 160 weight 150 + 140 130 120 110 62 64 66 70 72 74 + 68 height The relationship between child's weight to the child's height: A regression model can be used to describe the relationship between the child's weight and height. The graph above shows a positive relationship between the two. The scientists estimate that the relationship between the variables can be described as: Y= - 222.5+5.49X, where X is the child's height, and Y is the child's weight. For each one unit increase in the child's height, what is the average change in the child's weight? O Not enough information O +5.49 O-217.01 -222.5

Step by Step Solution

There are 3 Steps involved in it

1 Expert Approved Answer
Step: 1 Unlock blur-text-image
Question Has Been Solved by an Expert!

Get step-by-step solutions from verified subject matter experts

Step: 2 Unlock
Step: 3 Unlock

Students Have Also Explored These Related General Management Questions!