

Question: Fitting a straight line to a set of data yields the following prediction line. Complete (a) through (c) below. list K Y . = 12
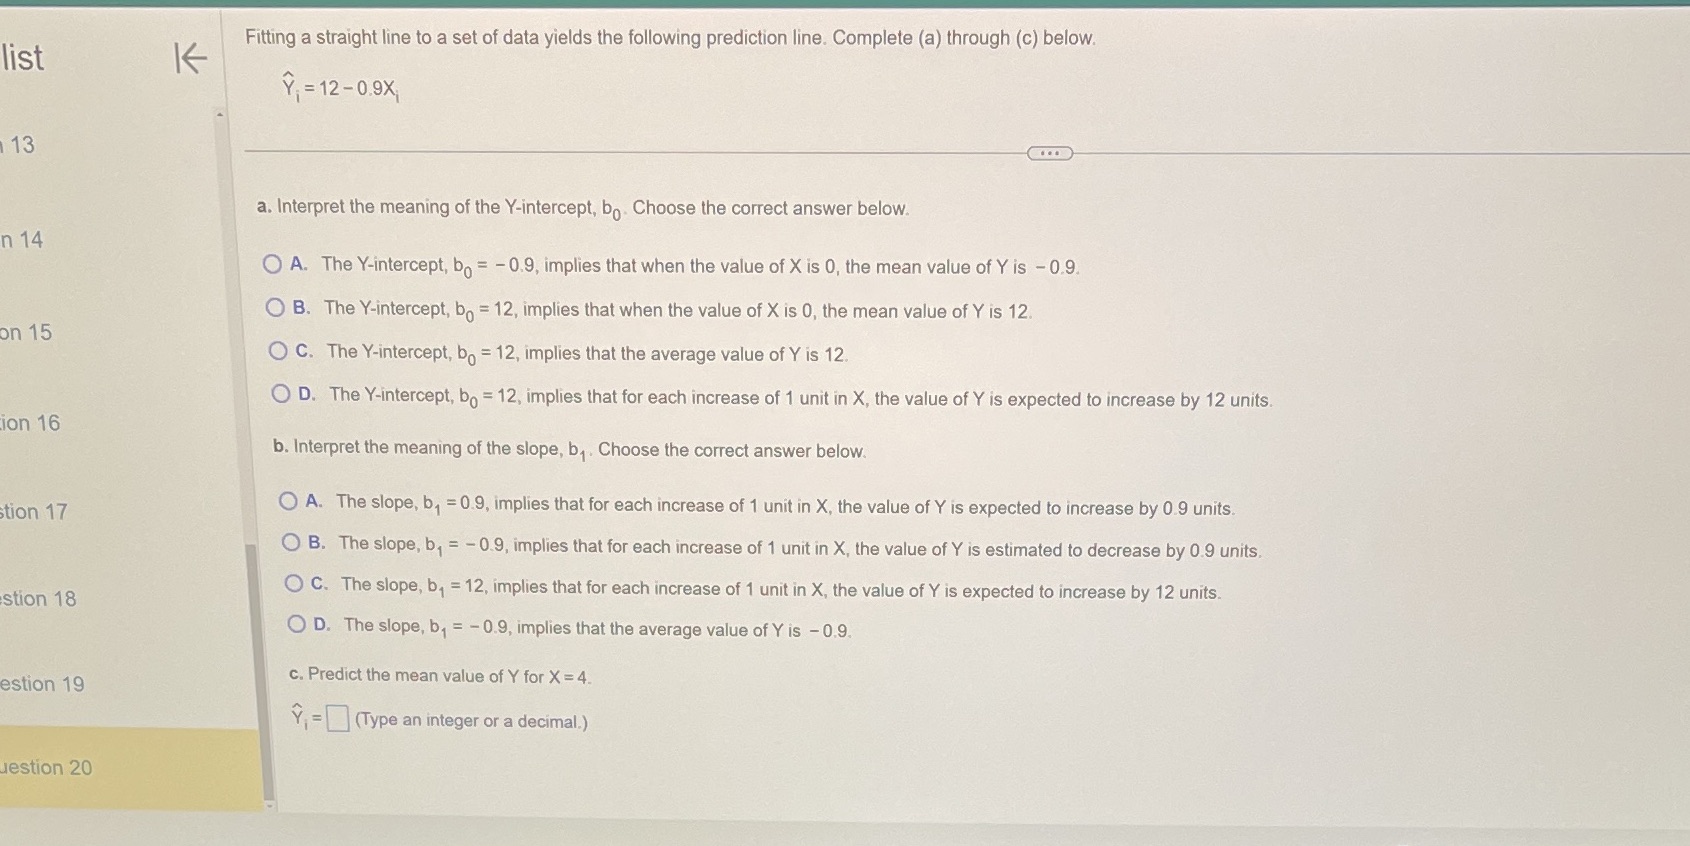
Fitting a straight line to a set of data yields the following prediction line. Complete (a) through (c) below. list K Y . = 12 - 0.9X 13 a. Interpret the meaning of the Y-intercept, bo. Choose the correct answer below. n 14 O A. The Y-intercept, bo = -0.9, implies that when the value of X is 0, the mean value of Y is - 0.9. O B. The Y-intercept, bo = 12, implies that when the value of X is 0, the mean value of Y is 12. on 15 O C. The Y-intercept, bo = 12, implies that the average value of Y is 12. O D. The Y-intercept, bo = 12, implies that for each increase of 1 unit in X, the value of Y is expected to increase by 12 units. ion 16 b. Interpret the meaning of the slope, bj . Choose the correct answer below. tion 17 O A. The slope, b, = 0.9, implies that for each increase of 1 unit in X, the value of Y is expected to increase by 0.9 units. O B. The slope, b, = - 0.9, implies that for each increase of 1 unit in X, the value of Y is estimated to decrease by 0.9 units. stion 18 O C. The slope, b, = 12, implies that for each increase of 1 unit in X, the value of Y is expected to increase by 12 units. O D. The slope, b, = - 0.9, implies that the average value of Y is - 0.9. estion 19 c. Predict the mean value of Y for X = 4. ", =(Type an integer or a decimal.) Jestion 20
Step by Step Solution
There are 3 Steps involved in it

Get step-by-step solutions from verified subject matter experts