

Question: five problem categories. Question 2 Prepare a scatter diagram for the following data set, and discuss the apparent relationship between the two variables. Take the
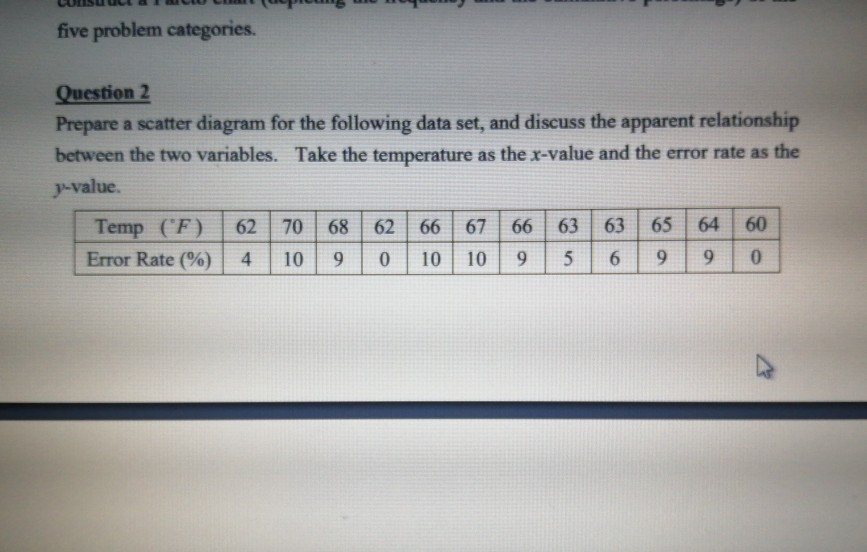
five problem categories. Question 2 Prepare a scatter diagram for the following data set, and discuss the apparent relationship between the two variables. Take the temperature as the r-value and the error rate as the p-value. 62 70 68 62 66 67 66 63 63 65 64 60 Temp (F) Error Rate (%) 4 10 9 0 10 10 9 5 5 6 9 9 0
Step by Step Solution
There are 3 Steps involved in it
1 Expert Approved Answer
Step: 1 Unlock

Question Has Been Solved by an Expert!
Get step-by-step solutions from verified subject matter experts
Step: 2 Unlock
Step: 3 Unlock