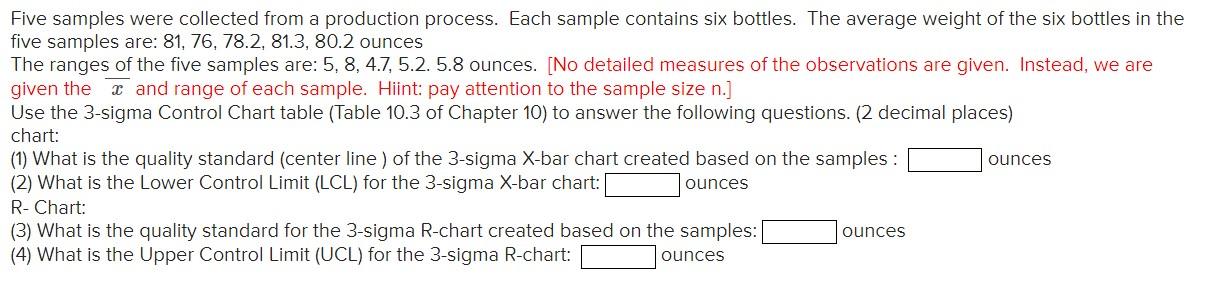
Question: Five samples were collected from a production process. Each sample contains six bottles. The average weight of the six bottles in the five samples are:

Five samples were collected from a production

Five samples were collected from a production process. Each sample contains six bottles. The average weight of the six bottles in the five samples are: 81, 76, 78.2, 81.3, 80.2 ounces The ranges of the five samples are: 5, 8, 4.7, 5.2.5.8 ounces. [No detailed measures of the observations are given. Instead, we are given the 3 and range of each sample. Hiint: pay attention to the sample size n.] Use the 3-sigma Control Chart table (Table 10.3 of Chapter 10) to answer the following questions. (2 decimal places) chart: (1) What is the quality standard (center line ) of the 3-sigma X-bar chart created based on the samples: ounces (2) What is the Lower Control Limit (LCL) for the 3-sigma X-bar chart: ounces R-Chart: (3) What is the quality standard for the 3-sigma R-chart created based on the samples: ounces (4) What is the Upper Control Limit (UCL) for the 3-sigma R-chart: ounces

Step by Step Solution

There are 3 Steps involved in it

1 Expert Approved Answer
Step: 1 Unlock blur-text-image
Question Has Been Solved by an Expert!

Get step-by-step solutions from verified subject matter experts

Step: 2 Unlock
Step: 3 Unlock

Students Have Also Explored These Related General Management Questions!