

Question: Flag when developing forecasts, analysts should most likely: a. develop possibilites relying exclusively on the results of financial analysis b. use the results of financial
Flag
when developing forecasts, analysts should most likely:
a. develop possibilites relying exclusively on the results of financial analysis
b. use the results of financial analysis, analysis of other information, and judgement
c. aim to develop extremly precise forecasts using the results of financial analysi?????si

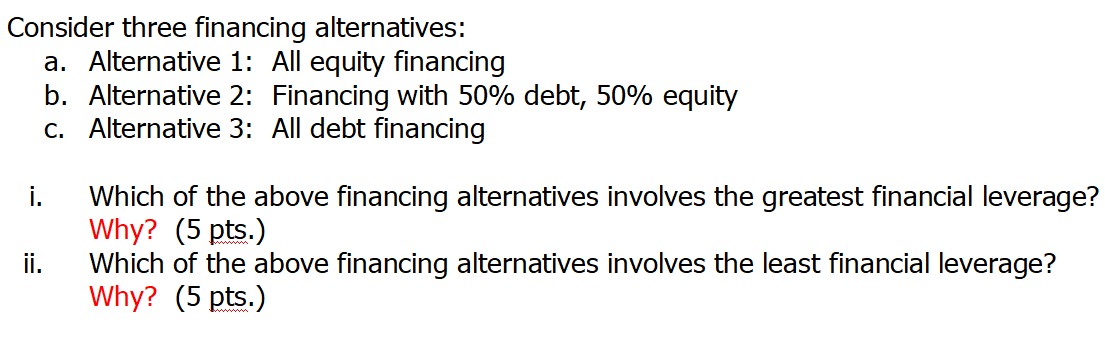
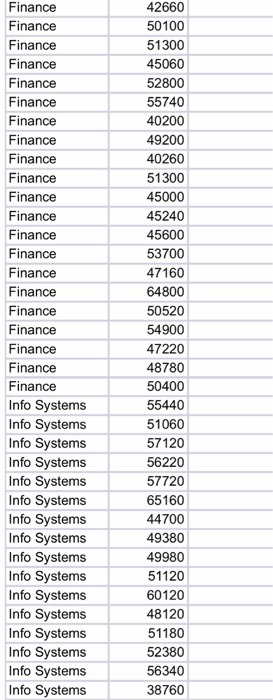

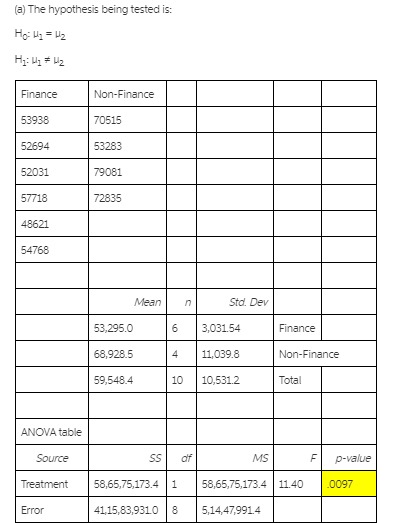
Question Two. (6 Marks): Your organization is considering the use of group decision making. You have read about decision making and are trying to inform your manager about the advantages and disadvantages of group decision making. Give TWO examples to explain when group decision making is recommended over Individual decision making and TWO examples when Individual decision making is better.Consider three financing alternatives: a. Alternative 1: All equity financing b. Alternative 2: Financing with 50% debt, 50% equity c. Alternative 3: All debt financing i. Which of the above financing alternatives involves the greatest financial leverage? Why? (5 pts.) ii. Which of the above financing alternatives involves the least financial leverage? Why? (5 pts.)Finance 42660 Finance 50100 Finance 51300 Finance 45060 Finance 52800 Finance 55740 Finance 40200 Finance 49200 Finance 40260 Finance 51300 Finance 45000 Finance 45240 Finance 45600 Finance 53700 Finance 47160 Finance 64800 Finance 50520 Finance 54900 Finance 47220 Finance 48780 Finance 50400 Info Systems 55440 Info Systems 51060 Info Systems 57120 Info Systems 56220 Info Systems 57720 Info Systems 65160 Info Systems 44700 Info Systems 49380 Info Systems 49980 Info Systems 51120 Info Systems 60120 Info Systems 48120 Info Systems 51180 Info Systems 52380 Info Systems 56340 Info Systems 38760Distinguish between project financing and corporate financing. Does project financing equivalent to project cost management? Explain.(a) The hypothesis being tested is: Ho: My = H2 Finance Non-Finance 53938 70515 52694 53283 52031 79081 57718 72835 48621 54768 Mean n Std. Dev 53,295.0 6 3,031.54 Finance 68,928.5 4 11,039.8 Non-Finance 59,548.4 10 10,531.2 Total ANOVA table Source SS MS F p-value Treatment 58,65,75,173.4 1 58,65,75,173.4 11.40 .0097 Error 41,15,83,9310 8 5,14,47,991.4
Step by Step Solution
There are 3 Steps involved in it

Get step-by-step solutions from verified subject matter experts