

Question: Flash Memory, Inc. Exhibit 4 Selected Financial Information for Flash Memory, Inc., and Selected Competitors, 2007 through 2009 Flash Memory, Inc. Micron Technology 2007
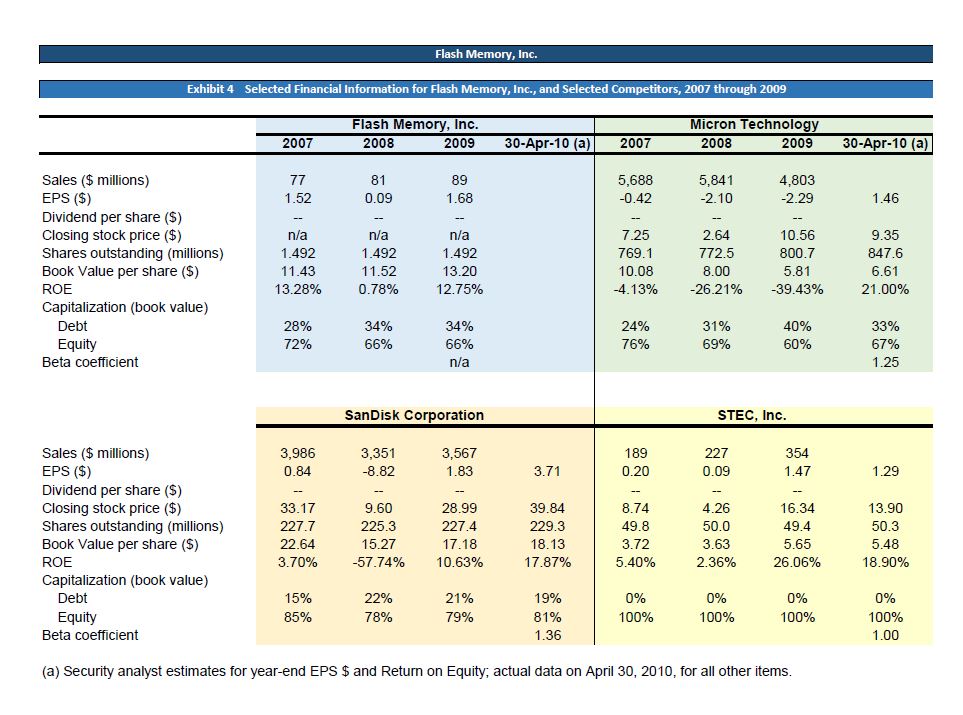
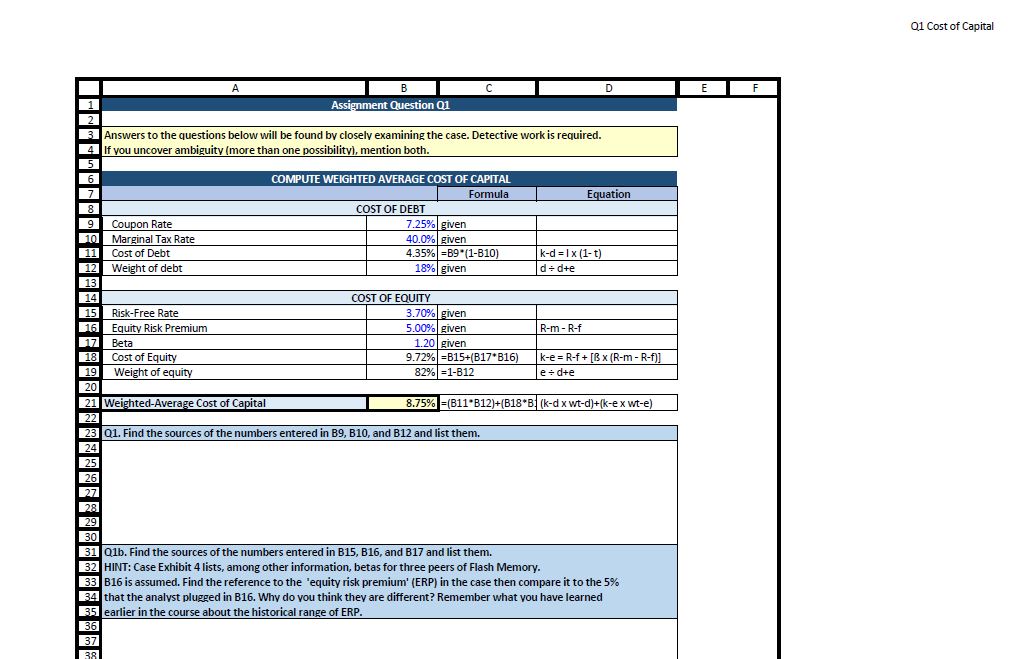
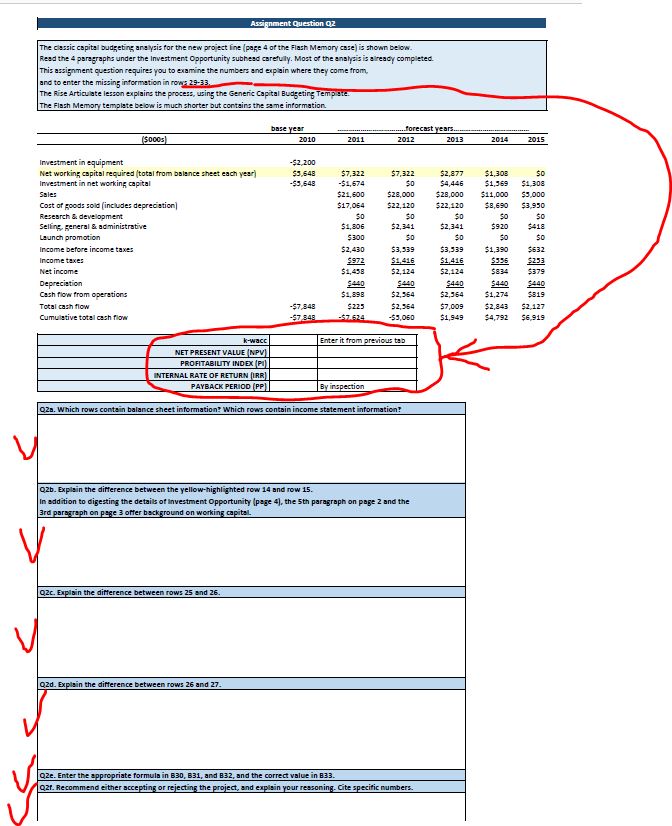
Flash Memory, Inc. Exhibit 4 Selected Financial Information for Flash Memory, Inc., and Selected Competitors, 2007 through 2009 Flash Memory, Inc. Micron Technology 2007 2008 2009 30-Apr-10 (a) 2007 2008 2009 30-Apr-10 (a) Sales ($ millions) 77 81 89 5,688 5,841 4,803 EPS ($) 1.52 0.09 1.68 -0.42 -2.10 -2.29 1.46 Dividend per share ($) - - - - -- Closing stock price ($) n/a n/a n/a 7.25 2.64 10.56 9.35 Shares outstanding (millions) 1.492 1.492 1.492 769.1 772.5 800.7 847.6 Book Value per share ($) 11.43 11.52 13.20 10.08 8.00 5.81 6.61 ROE 13.28% 0.78% 12.75% -4.13% -26.21% -39.43% 21.00% Capitalization (book value) Debt 28% 34% 34% 24% 31% 40% 33% Equity 72% 66% 66% 76% 69% 60% 67% Beta coefficient n/a 1.25 Sales ($ millions) EPS ($) SanDisk Corporation STEC, Inc. 3,986 0.84 3,351 3,567 189 227 354 -8.82 1.83 3.71 0.20 0.09 1.47 1.29 Dividend per share ($) - -- - - -- Closing stock price ($) 33.17 9.60 28.99 39.84 8.74 4.26 16.34 13.90 Shares outstanding (millions) 227.7 225.3 227.4 229.3 49.8 50.0 49.4 50.3 Book Value per share ($) 22.64 15.27 17.18 18.13 3.72 3.63 5.65 5.48 ROE 3.70% -57.74% 10.63% 17.87% 5.40% 2.36% 26.06% 18.90% Capitalization (book value) Debt 15% 22% 21% 19% 0% 0% 0% 0% Equity 85% 78% 79% 81% 100% 100% 100% 100% Beta coefficient 1.36 1.00 (a) Security analyst estimates for year-end EPS $ and Return on Equity; actual data on April 30, 2010, for all other items. 1 2 A B C Assignment Question Q1 3 Answers to the questions below will be found by closely examining the case. Detective work is required. 4 If you uncover ambiguity (more than one possibility), mention both. 5 6 7 8 9 Coupon Rate 10 Marginal Tax Rate 11 Cost of Debt 12 Weight of debt 13 14 15 D F COMPUTE WEIGHTED AVERAGE COST OF CAPITAL Formula Equation COST OF DEBT 7.25% given 40.0% given 4.35% B9 (1-B10) 18% given k-d=1x (1-t) d+d+e Risk-Free Rate 16 Equity Risk Premium 17 Beta 18 Cost of Equity 19 Weight of equity 20 21 Weighted-Average Cost of Capital 22 COST OF EQUITY 3.70% given 5.00% given 1.20 given 9.72% B15+(B17*B16) 82% =1-B12 R-m-R-f k-e R-f+[Bx (R-m-R-f)] e+d+e 8.75% =(B11 B12)+(B18*B(k-dx wt-d)+(k-ex wt-e) 23 Q1. Find the sources of the numbers entered in B9, B10, and B12 and list them. 24 25 26 27 28 29 30 31 Q1b. Find the sources of the numbers entered in B15, B16, and B17 and list them. 32 HINT: Case Exhibit 4 lists, among other information, betas for three peers of Flash Memory. 33 B16 is assumed. Find the reference to the 'equity risk premium' (ERP) in the case then compare it to the 5% 34 that the analyst plugged in B16. Why do you think they are different? Remember what you have learned 35 earlier in the course about the historical range of ERP. 36 37 38 Q1 Cost of Capital Assignment Question Q2 The classic capital budgeting analysis for the new project line (page 4 of the Flash Memory case) is shown below. Read the 4 paragraphs under the Investment Opportunity subhead carefully. Most of the analysis is already completed. This assignment question requires you to examine the numbers and explain where they come from, and to enter the missing information in row: 29-33. The Rise Articulate lesson explains the process, using the Generic Capital Budgeting Template. The Flash Memory template below is much shorter but contains the same information. (5000s) base year forecast years. 2010 2011 2012 2013 2014 2015 Investment in equipment -$2,200 Net working capital required (total from balance sheet each year) $5,648 $7,322 $7,322 Investment in net working capital -$3,648 -$1,674 50 Sales $21,600 $28,000 $2,877 $4,446 $28,000 $1,308 $1,369 $1,308 50 $11,000 $5,000 Cost of goods sold (includes depreciation) Research & development $17,064 50 $22,120 $0 $22,120 $0 $8,690 $3,950 50 Selling, general & administrative $1,806 $2,341 $2,341 $920 $418 Launch promotion Income before income taxes Income taxes Net income Depreciation Cash flow from operations Total cash flow $300 $0 50 50 50 $2,430 $3,339 $3,339 $1,390 $632 $972 $1,416 $1,416 $556 $253 $1,458 $2,124 $2,124 $834 $379 $440 $440 $440 $440 $440 $1,898 $2,564 $2,364 $1,274 $819 -$7,848 $225 $2,564 $7,009 $2,843 $2,127 Cumulative total cash flow -$7.848 -57.624 -$3,060 $1,949 $4,792 $6,919 k-wacc Enter it from previous tab NET PRESENT VALUE (NPV) PROFITABILITY INDEX (PI) INTERNAL RATE OF RETURN (IRR) PAYBACK PERIOD (PP) By inspection Q2a. Which rows contain balance sheet information? Which rows contain income statement information? Q2b. Explain the difference between the yellow-highlighted row 14 and row 15. In addition to digesting the details of Investment Opportunity (page 4), the 5th paragraph on page 2 and the 3rd paragraph on page 3 offer background on working capital. Q2c. Explain the difference between rows 25 and 26. Q2d. Explain the difference between rows 26 and 27. Qze. Enter the appropriate formula in 630, 831, and 832, and the correct value in 833. Q2f. Recommend either accepting or rejecting the project, and explain your reasoning. Cite specific numbers. 4230 Flash Memory, Inc. Investment Opportunity One of Hathaway Browne's primary responsibilities as CFO was to finance both the growth of Flash's existing product lines and all new investments that were approved by the board of directors. Investment proposals were prepared by the company's design, manufacturing, and marketing managers, thoroughly analyzed by Browne and the finance group, and then sent to the board for discussion, evaluation, and finally acceptance or rejection. Browne had recently been given a proposal for a major new product line, which was expected to have a significant impact on the company's sales, profits, and cash flows. This new product line had been in development for the past nine months, and $400,000 had already been spent taking the product from the concept stage to the point where working prototypes had been built and were currently being tested. Flash's design and marketing people were very excited about this new product line, believing its combination of speed, size, density, reliability, and power consumption, would make it a winner in the fastest growing segment of the memory industry. Customer acceptance and competitor reaction to the new product line was uncertain, but the project's sponsors were confident it would generate sales of at least $21.6 million in 2011 and $28 million in 2012 and 2013, before falling off to $11 million in 2014 and $5 million in 2015. The product was also believed to be superior to existing memory products, and would therefore command gross margins of 21% throughout its life. Implementing this new product line would also require large investments and expenditures by the company. New plant and equipment costing $2.2 million must be purchased, and this specific equipment would be depreciated straight-line to zero salvage value over its five-year life. This depreciation expense all flowed to cost of goods sold expense, and was already included in the estimate that cost of goods sold would be 79% of sales. Flash also expected net working capital would be 26.15% of sales. This initial investment in equipment and net working capital would occur in 2010, and in subsequent years the net working capital would increase and then decrease, as sales of the new product line rose and then fell. SG&A expenses were expected to be the same percent of sales as the company experienced in 2009, but in addition the marketing manager also planned a one- time $300,000 advertising and promotion campaign simultaneous with the launch of the product in 2011.
Step by Step Solution
There are 3 Steps involved in it

Get step-by-step solutions from verified subject matter experts