

Question: Flexible Budgeting and Financial Statement Analysis in Tableau 9-1 (Static) Skip to question [The following information applies to the questions displayed below.] Williams Company is
Flexible Budgeting and Financial Statement Analysis in Tableau 9-1 (Static)
Skip to question
[The following information applies to the questions displayed below.] Williams Company is a merchandiser and its accounting department has finished preparing a flexible budget to better understand the differences between its actual results and the master budget. The chief financial officer (CFO) would like your assistance in interpreting some data visualizations that she will use to explain why the companys actual results differed from its master budget. Required: Review the Tableau dashboards that the CFO has given you and answer the questions that follow.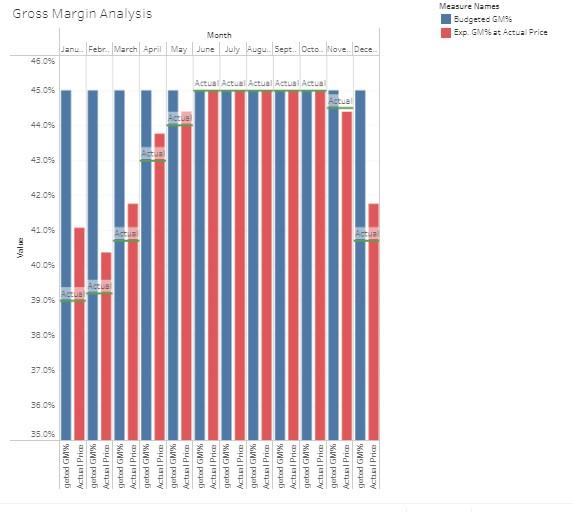
(For each question you may select more than one answer. Single click the box with the question mark to produce a check mark for a correct answer and double click the box with the question mark to empty the box for a wrong answer. Any boxes left with a question mark will be automatically graded as incorrect.)
2a. Which of the following statements are true with respect to the Gross Margin Analysis visualization?
check all that apply 1
- The red bars show each months expected gross margin percentage at that months actual average selling price.unanswered
- The blue bars depict each months budgeted gross margin percentage.unanswered
- The horizontal green lines depict each months actual gross margin percentage.unanswered
2b. Which of the following statements are true with respect to the Gross Margin Analysis visualization? check all that apply 2
- The budgeted gross margin percentage in February is less than that months expected gross margin percentage at the actual selling price.unanswered
- The budgeted gross margin percentage in February is greater than that months expected gross margin percentage at the actual selling price.unanswered
- The budgeted gross margin percentage in August is less than that months expected gross margin percentage at the actual selling price.unanswered
- The budgeted gross margin percentage in August is greater than that months expected gross margin percentage at the actual selling price.unanswered
2c. Which of the following statements are true with respect to the Gross Margin Analysis visualization? check all that apply 3
- The actual gross margin percentage in March is less than that months expected gross margin percentage at the actual selling price.unanswered
- The actual gross margin percentage in March is greater than that months expected gross margin percentage at the actual selling price.unanswered
- The actual gross margin percentage in December is greater than that months expected gross margin percentage at the actual selling price.unanswered
- The actual gross margin percentage in December is less than that months expected gross margin percentage at the actual selling price.unanswered
2d. Which of the following insights are revealed by the Gross Margin Analysis visualization? check all that apply 4
- The companys cost of goods sold as a percent of sales must be less than expected in months where the companys actual selling price equals the budgeted price.unanswered
- The companys cost of goods sold as a percent of sales must be greater than expected in months where the companys actual selling price equals the budgeted price.unanswered
- The companys cost of goods sold as a percent of sales must be greater than expected in months where the companys actual selling price is less than the budgeted price.unanswered
- The companys cost of goods sold as a percent of sales must be less than expected in months where the companys actual selling price is less than the budgeted price.unanswered
Value 11 IN 41 35 0% 45.0% gated GM' Actie Price gatex GMX Actiil Price gated GMX Actual Price gated GM'% Actie Price getal GMX Actiil Price Gated GMX Actual Price gated GM'% Actin Price gatex GMX Actual Price good GMX Actual Price gebed GM' Actal Price geta GM% Actual Price gotad GMX Actual Price 46.0% Gross Margin Analysis Janu. Febr. Marchpril May June July Augu. Sept. Deto Nove. Dece Month Actual Actual Actual Actual Actual Measure Names Budgeted GSS Exp. Gli at Actual Price
Step by Step Solution
There are 3 Steps involved in it

Get step-by-step solutions from verified subject matter experts