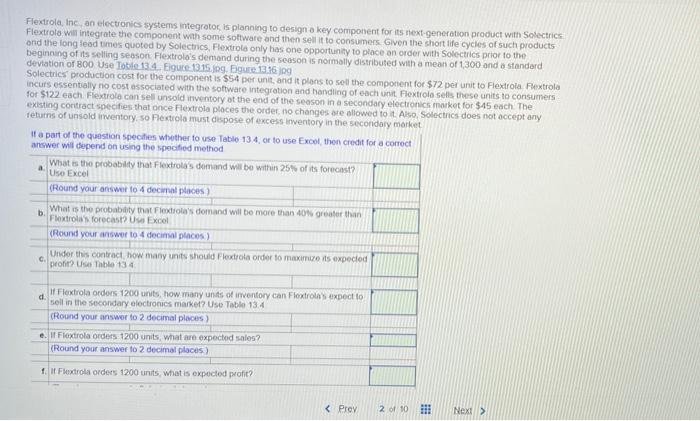
Question: Flextrola, Inc. an electronics systems integrator is planning to design a key component for its next-generation product with Solectrics Flextrolo Will integrate the component with

Flextrola, Inc. an electronics systems integrator
Flextrola, Inc. an electronics systems integrator is planning to design a key component for its next-generation product with Solectrics Flextrolo Will integrate the component with some software and then sell it to consumers. Given the short life cycles of such products and the long lead times quoted by Solectrics Flextrots only has one opportunity to place an order with Solectrics prior to the beginning of its selling season Flextrolo's demand during the season is normally distributed with a mean of 1300 and a standard deviation of 800 Use Tobte 134. Eigure 1315.g. Egure 133609 Solectrics production cost for the component is $54 per unit, and it plans to sell the component for $72 per unit to Flextroia Flextrola incurs essentially no cost associated with the software integration and handling of each unit Flextrole sells these units to consumers for $122 each Flextile can sell unsold inventory at the end of the season in a secondary electronics market for $45 each. The existing contract specifies that once Flextrola places the order no changes ate allowed to it. Also, Solectrics does not accept any returns of unsold inventory. so Flextrola must dispose of excess inventory in the secondary market If a part of the question specifies whether to use Table 13.4. or to use Excel, then credit for a correct answer wil depend on using the specified method What is the probability that Flextrola's demand will be within 25 of its forecast? Uso Excel (Round your answer to decimal places What is the probability that Flextiota's domand will be more than 40 greater than b Flextrots forecast? U Excel (Round your answer to decimal places) Under this contract, how many units should Flextrola order to maximize its expected pont Us Tablo 134 d If Flextrola orders 1200 units, how many units of inventory can Foxtrot expect to sell in the secondary electronics market? Use Table 13.4 (Round your answer to 2 decimal places) e. Flextrola orders1200 units, what are expected sales? (Round your answer to 2 decimal places) 1. it Flextrola orders 1200 units what is expected profit? TABLE 13.4 The Distribution, FO), and Expected Inventory. I(C). Functions for the Standard Normal Distribution Function Fiz) A(z) -40 .0000 0000 -3.9 .0000 0000 -3.8 0001 0000 -37 0001 .0000 -36 0002 0000 -3.5 0002 0001 -3.4 0003 0001 -3.3 0005 0001 -3.2 0007 0002 -31 0010 0003 -3.0 0013 0004 no 56 FAO 3 Type here to search O F SPM 1/11/2022 B -2.9 0019 .0005 -28 0026 0008 -27 .0035 .0011 -2.6 .0047 .0015 -2.5 0062 .0020 -24 0082 0027 -23 0107 0037 -22 0139 0049 -2.1 0179 0065 -2.0 0228 0085 -1.9 0287 0111 -18 0359 0143 - 17 0446 0183 -16 0548 0232 -1.5 0668 0293 -1.4 0808 .0367 -13 0968 .0455 -1.2 .1151 0561 -11 1357 .0686 -1.0 1587 0833 -0.9 .1841 1004 -0.8 2119 1202 -0.7 2420 .1429 -0.6 2743 .1687 -0.5 .3085 1978 -0.4 3445 2304 -0.3 3821 2668 -0.2 4207 3069 13 .9032 13455 1.4 9192 1.4367 1.5 .9332 1.5293 1.6 9452 1.6232 17 9554 1.7183 1.8 9641 1.8143 1.9 9713 1.9111 2.0 .9772 2.0085 21 9821 2.1065 2.2. 9861 2.2049 23 9893 2.3037 2.4 .9918 2.4027 2.5 .9938 2.5020 2.6 9953 2.6015 27 .9965 2.7011 2.8 9974 2.8008 2.9 19981 2.9005 3.0 9987 3.0004 31 9990 3.1003 3.2 9993 3.2002 3:3 9995 3.3001 34 9997 3.4001 3.5 9998 3.5001 3.6 9998 3.6000 37 9999 3.7000 3.8 9999 38000 3.9 1.0000 3.9000 40 10000 4.0000 Distribution Function 1.00 .90 Log normal distribution .80 + .70 .60 Probability .50 + .40 Normal distribution .30 .20 .10 .00 0 HHH 250 500 750 1000 1250 1500 1750 2000 2250 2500 Demand Figure 13.15 The density functions for a log normal and a normal distribution with mean 1000 and standard deviation 600 Density Function .0012 .0011 .0010 Log normal distribution .0009 .0008 .0007 Probability .0006 - Normal distribution .0005 .0004 - .0003 .0002 .0001 - .0000 + 0 |||||||||||||||||||||||| 500 750 1000 1250 1500 1750 2000 2250 2500 250 Demand

Step by Step Solution

There are 3 Steps involved in it

1 Expert Approved Answer
Step: 1 Unlock blur-text-image
Question Has Been Solved by an Expert!

Get step-by-step solutions from verified subject matter experts

Step: 2 Unlock
Step: 3 Unlock

Students Have Also Explored These Related General Management Questions!