Flight of an Osprey An observer in a fishing boat watched as an osprey dove un in
Fantastic news! We've Found the answer you've been seeking!
Question:
Flight of an Osprey
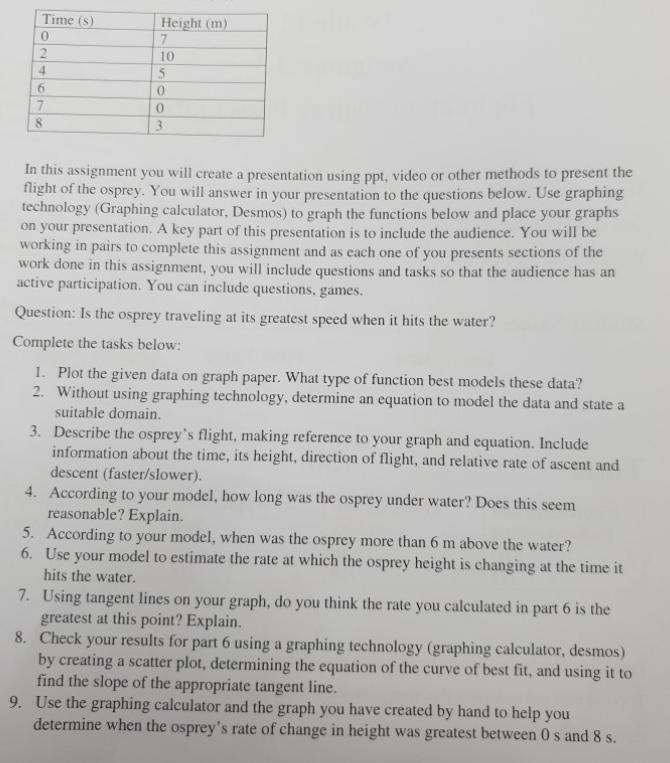
An observer in a fishing boat watched as an osprey dove un in its talons. The observer was able to record the flight of the osprey at watched as an osprey dove under water and re-emerged with a fish erver was able to record the flight of the osprey during this behavior and the data is recorded on the table below.
Transcribed Image Text:
Time (s) Height (m) 10 4. 7. 0. 8. In this assignment you will create a presentation using ppt, video or other methods to present the flight of the osprey. You will answer in your presentation to the questions below. Use graphing technology (Graphing calculator, Desmos) to graph the functions below and place your graphs on your presentation. A key part of this presentation is to include the audience. You will be working in pairs to complete this assignment and as each one of you presents sections of the work done in this assignment, you will include questions and tasks so that the audience has an active participation. You can include questions, games. Question: Is the osprey traveling at its greatest speed when it hits the water? Complete the tasks below: 1. Plot the given data on graph paper. What type of function best models these data? 2. Without using graphing technology, determine an equation to model the data and state a suitable domain. 3. Describe the osprey's flight, making reference to your graph and equation. Include information about the time, its height, direction of flight, and relative rate of ascent and descent (faster/slower). 4. According to your model, how long was the osprey under water? Does this seem reasonable? Explain. 5. According to your model, when was the osprey more than 6 m above the water? 6. Use your model to estimate the rate at which the osprey height is changing at the time it hits the water. 7. Using tangent lines on your graph, do you think the rate you calculated in part 6 is the greatest at this point? Explain. 8. Check your results for part 6 using a graphing technology (graphing calculator, desmos) by creating a scatter plot, determining the equation of the curve of best fit, and using it to find the slope of the appropriate tangent line. 9. Use the graphing calculator and the graph you have created by hand to help you determine when the osprey's rate of change in height was greatest between 0 s and 8 s. Time (s) Height (m) 10 4. 7. 0. 8. In this assignment you will create a presentation using ppt, video or other methods to present the flight of the osprey. You will answer in your presentation to the questions below. Use graphing technology (Graphing calculator, Desmos) to graph the functions below and place your graphs on your presentation. A key part of this presentation is to include the audience. You will be working in pairs to complete this assignment and as each one of you presents sections of the work done in this assignment, you will include questions and tasks so that the audience has an active participation. You can include questions, games. Question: Is the osprey traveling at its greatest speed when it hits the water? Complete the tasks below: 1. Plot the given data on graph paper. What type of function best models these data? 2. Without using graphing technology, determine an equation to model the data and state a suitable domain. 3. Describe the osprey's flight, making reference to your graph and equation. Include information about the time, its height, direction of flight, and relative rate of ascent and descent (faster/slower). 4. According to your model, how long was the osprey under water? Does this seem reasonable? Explain. 5. According to your model, when was the osprey more than 6 m above the water? 6. Use your model to estimate the rate at which the osprey height is changing at the time it hits the water. 7. Using tangent lines on your graph, do you think the rate you calculated in part 6 is the greatest at this point? Explain. 8. Check your results for part 6 using a graphing technology (graphing calculator, desmos) by creating a scatter plot, determining the equation of the curve of best fit, and using it to find the slope of the appropriate tangent line. 9. Use the graphing calculator and the graph you have created by hand to help you determine when the osprey's rate of change in height was greatest between 0 s and 8 s.
Expert Answer:
Answer rating: 100% (QA)
Qns 79 7 If we fit it by hand we can see that the height is 0 at two times so the equation must have ... View the full answer
Related Book For
Posted Date:
Students also viewed these mathematics questions
-
Before filing for bankruptcy protection, the company was able to buy a large shipment of snow tubes wholesale for a bargain price of $7 million from a supplier that was in financial trouble. The...
-
1. a. Explain how the Court was able to hold software distributors like Grokster liable for the misconduct of others (those who actually used the peer-to-peer networks to download copyrighted...
-
An ocean fishing boat is drifting just above a school of tuna on a foggy day. Without warning, an engine back-fire occurs on another boat 1.0 km away (Fig. 12-33). How much time elapses before the...
-
You are given the following information concerning three portfolios, the market portfolio, and the risk-free asset: What is the Sharpe ratio, Treynor ratio, and Jensens alpha for eachportfolio?...
-
Heritage Gardens provides complete garden design and landscaping services. The company uses a job-order costing system to track the costs of its landscaping projects. The table below provides data...
-
A lighted candle is placed 36 cm in front of a converging lens of focal length f1 = 13cm, which in turn is 56 cm in front of another converging lens of focal length f2 = 16 cm (see Fig. 23-60). (a)...
-
In the months leading up to the 2016 election, Christopher Steele, a former British intelligence agent, was hired by a Washington, D.C., research firm to investigate whether then-candidate Donald...
-
As manager of the St. Cloud Theatre Company, you have decided that concession sales will support themselves. The following table provides the information you have been able to put together thus far:...
-
5. A compact car has a maximum acceleration of 4.5 m/s when it only carries the driver. The driver and the car combined, have a total mass of 1250 kg. What is the maximum acceleration after picking...
-
Listed below is a vertical analysis of selected information from the financial statements of five publicly traded Canadian companies: One of the companies included in the vertical analysis above...
-
Explain the difference between mental health and mental illness. Describe how understanding brain structure and theories related to mental health will guide your future practice as a PMHNP. Use...
-
= Recall that in class we designed an algorithm that takes two n digit numbers x, y and returns their product ry, in base 10, in time O(n) where a log2 3. In this problem, we'll use a subroutine...
-
The drawing shows an equilateral triangle, each side of which has a length of 3.63 cm. Point charges are fixed to each corner, as shown. The 4.00 C charge experiences a net force due to the charges...
-
The O NET is useful for ________ base(s) an employee's evaluations on whether the employee achieves specific performance goals. Question 8 options: A) Forced ranking B) Behaviorally anchored rating...
-
For this discussion, address the following: Examine both external and internal dynamics on a quality improvement project that you have experienced in your work. Evaluate how external and internal...
-
an investment of $12,000 earns an interest of 2.5% per year compounded monthly, for 6 years. calculate the Future value and effective annual interest rate
-
Discuss in details supporting the assertion that research generally supports that fiscal decentralisation has been linked to a variety of outcomes such as economic growth, fiscal imbalances, service...
-
How has the too-big-to-fail policy been limited in the FDICIA legislation? How might limiting the too-big-to-fail policy help reduce the risk of a future banking crisis?
-
Because of the spread of the West Nile virus in the state of New York, an insecticide spraying program was implemented to control the mosquitoes responsible for spreading the virus. Several groups...
-
1. What constitutional law defense would you offer on behalf of the Sheet Metal Workers union? 2. Decide the case. Explain. The Sheet Metal Workers union staged a mock funeral outside a Florida...
-
After being told that Yonaty was gay or bisexual, Mincolla relayed the rumor to Koffman, longtime friend of Yonatys girlfriend, hoping the girlfriend would learn of the rumor. The girlfriend was...
-
Suppose we have a small inhabited island with three residents and a volcano that generates air pollution. Two people live upwind of the volcano and one person lives downwind. For \(\$ 21,000\) we can...
-
Assume a city of \(1,000,000\) people, \(60 \%\) of whom are willing to pay \(\$ 1\) maximum (each) to clean up pollution. The rest of the population is wealthier and is willing to pay \(\$ 100\)...
-
In Figure 3.2, using the Pareto criterion, which of the labeled points are socially preferred to \(W\) ? Figure 3.2 Brewster's utility B w' R Anna's utility S
Study smarter with the SolutionInn App