

Question: Flipped Case study The students should run the calculation and fill the table The students should analyze the company financial position and explain the strength
Flipped Case study
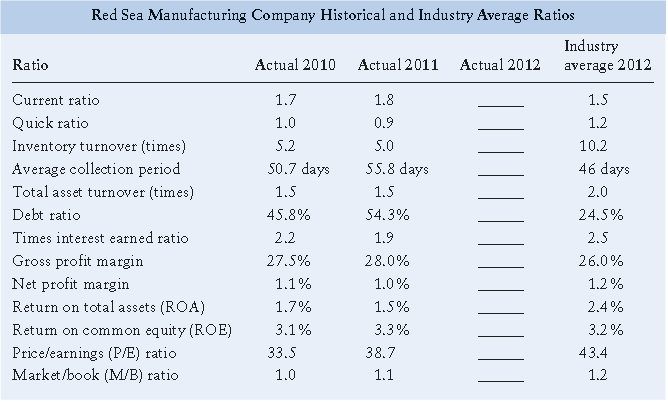
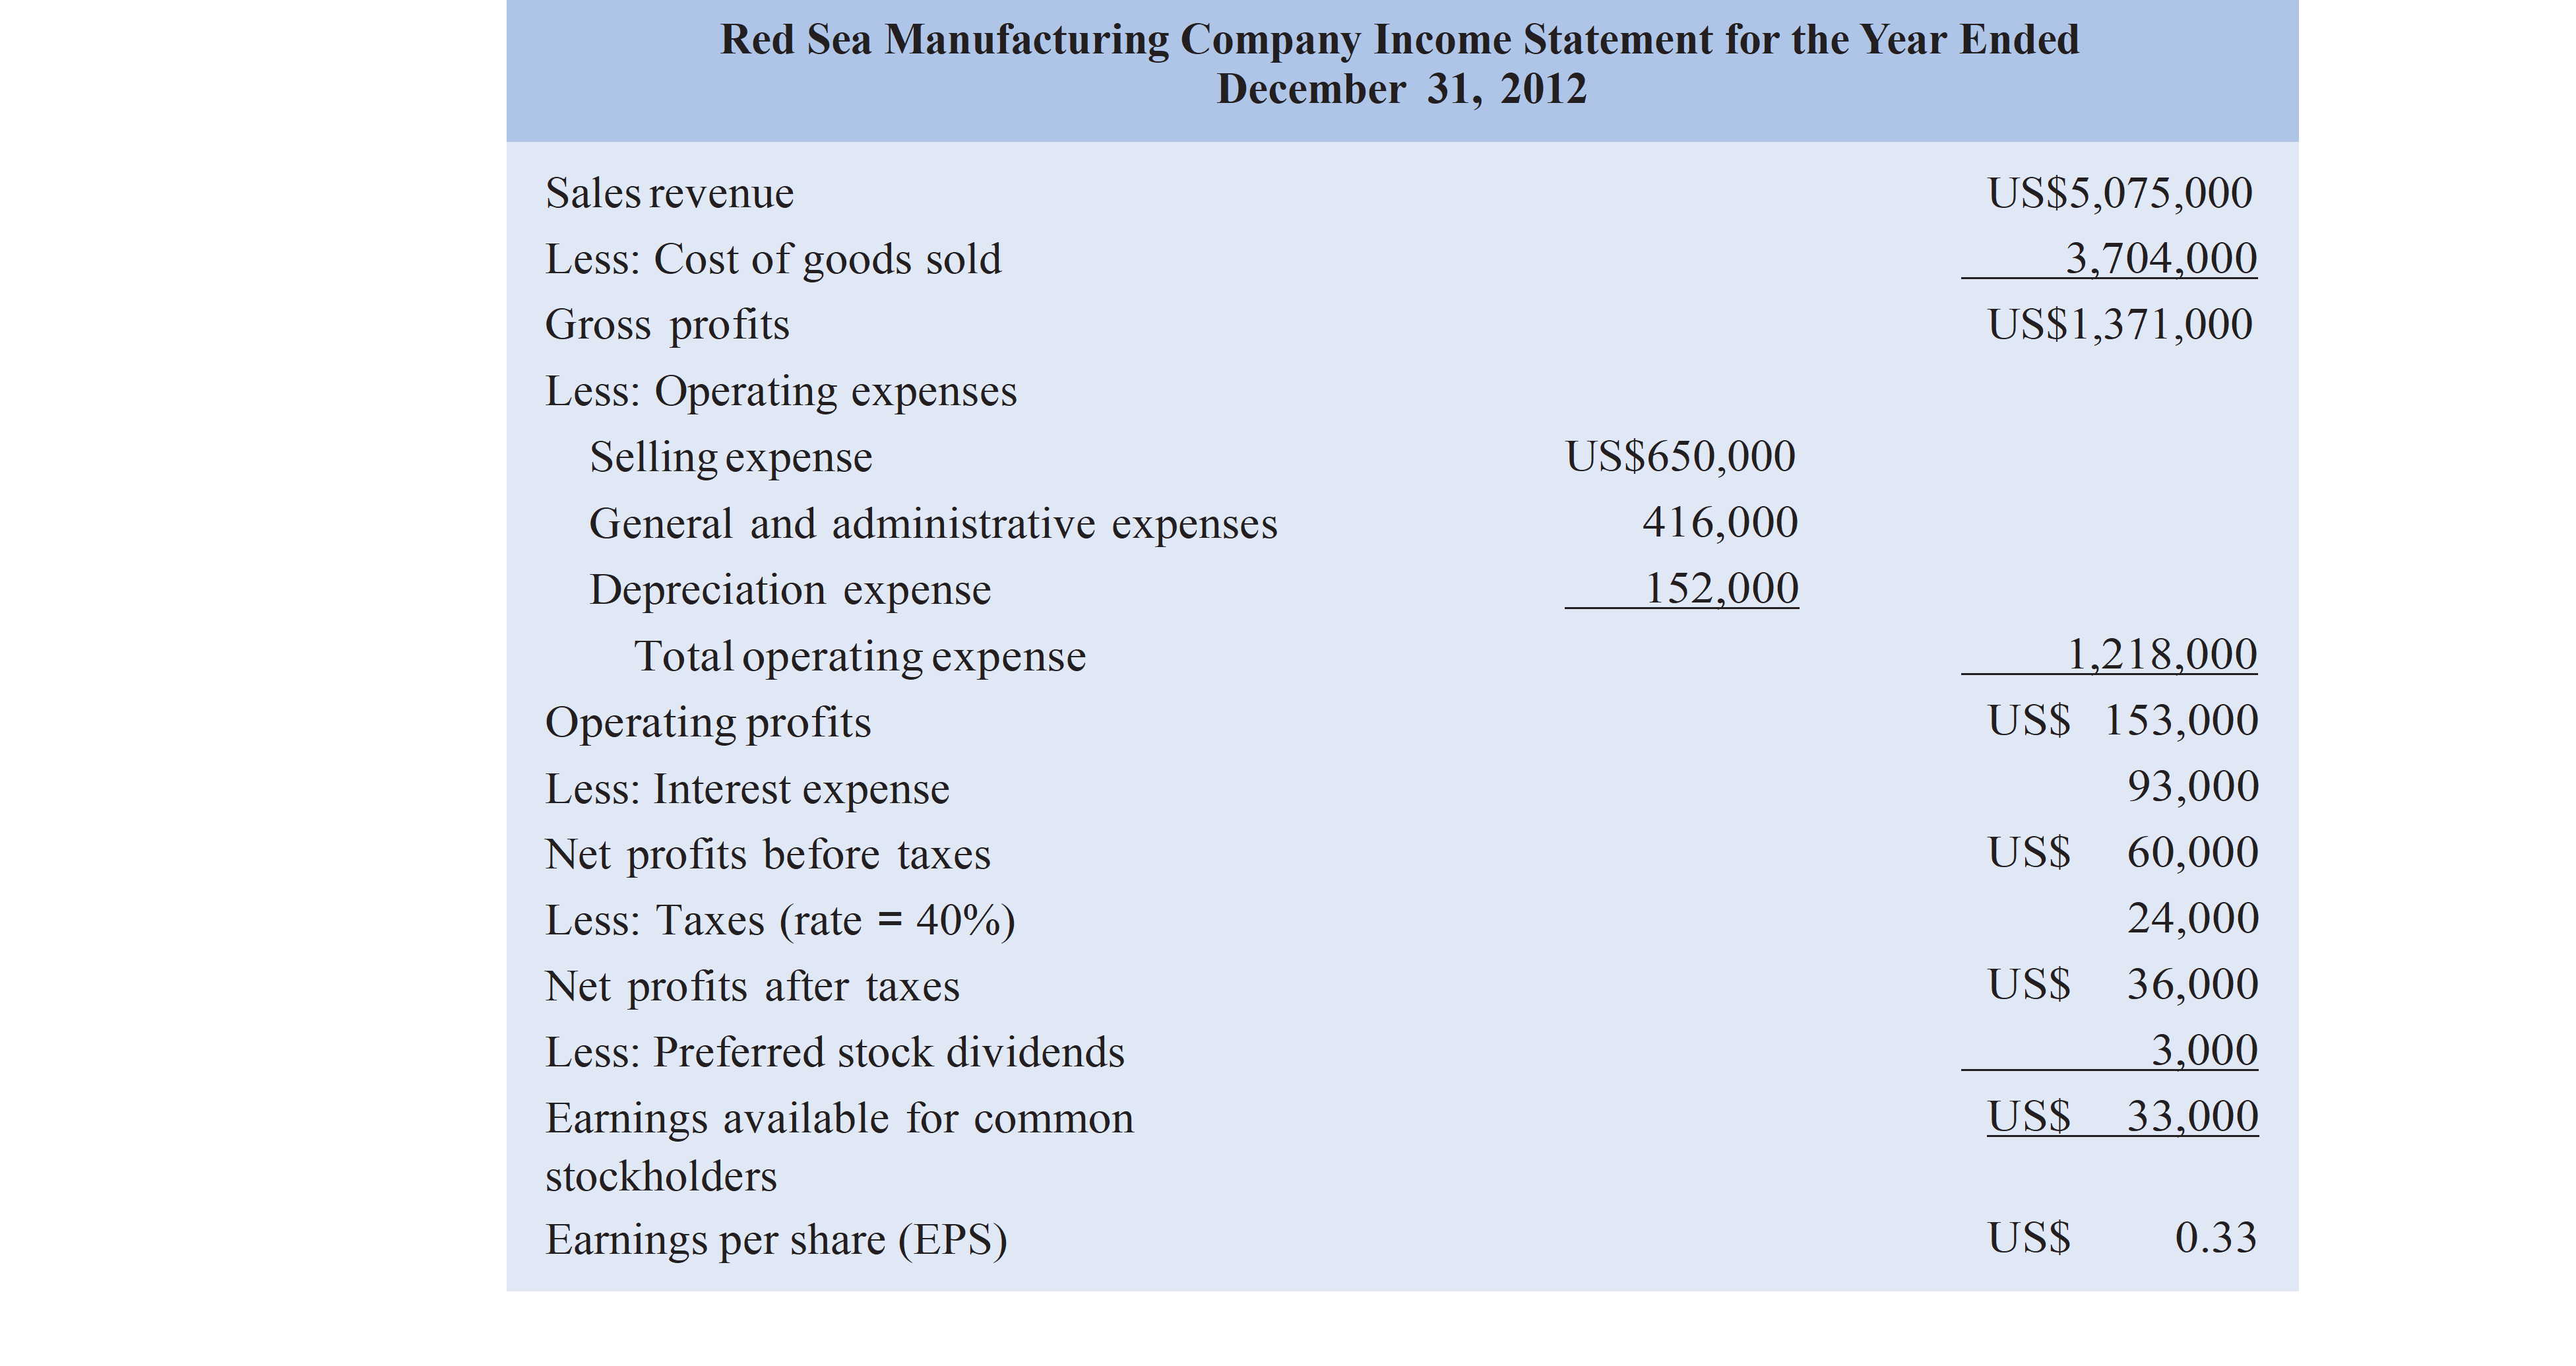
- The students should run the calculation and fill the table
- The students should analyze the company financial position and explain the strength and weakness points of the company
- The students should provide some reforms, to improve the firm's financial position, if required.
- Then after calculating the ratios before coming to the lecture, the discussion of the firm's current position from both cross-sectional and time-series viewpoint will be conducted in class. The discussion will include evaluations of the firm's liquidity, activity, debt, profitability and market value.
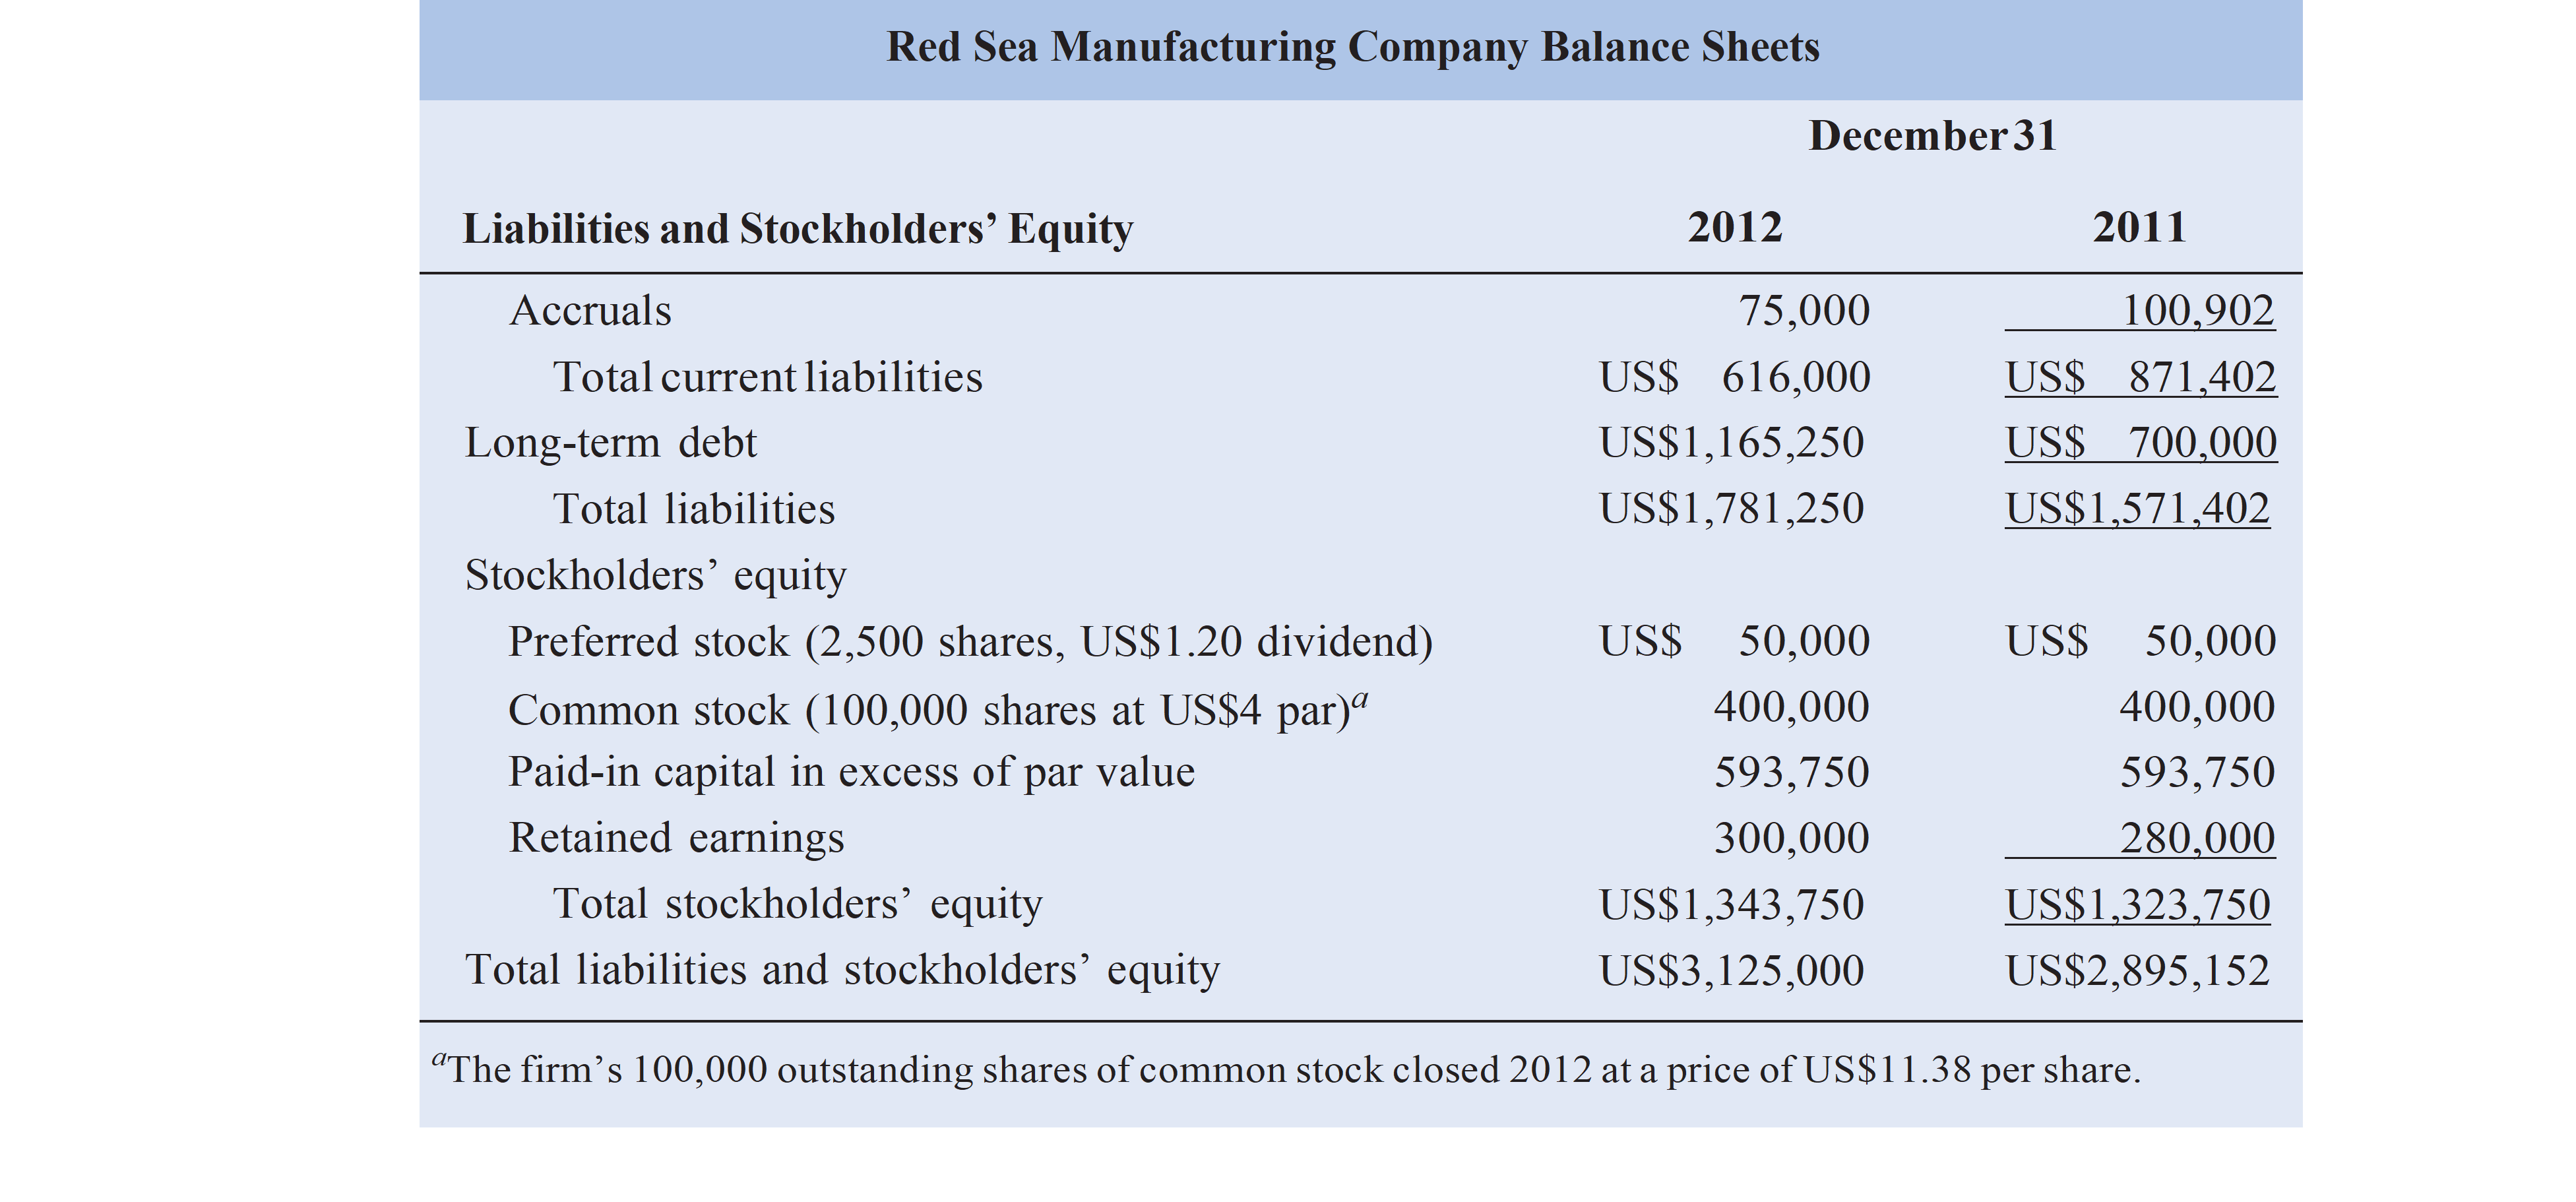
Red Sea Manufacturing Company Balance Sheets
Assets December 31
2012 2011
Current assets
Cash US$25,000 US$24,100
Accounts receivable 805,556 763,900
Inventories 700,625 763,445
Total current assets US$1,531,181 US$1,551,445
Gross fixed assets (at cost) US$2,093,819 US$1,691,707
Less: Accumulated depreciation 500,000 348,000
Net fixed assets US$1,593,819 US$1,343,707
Total assets US$3,125,000 US$2,895,152
Liabilities and Stockholders' Equity
Current liabilities
Accounts payable US$ 230,000 US$ 400,500
Notes payable 311,000 370,000
Step by Step Solution
There are 3 Steps involved in it
1 Expert Approved Answer
Step: 1 Unlock

Question Has Been Solved by an Expert!
Get step-by-step solutions from verified subject matter experts
Step: 2 Unlock
Step: 3 Unlock