

Question: fLook at the following bar graph, generated from the table of sample date from the National Longitudinal Study of Youth. Which variable do you think


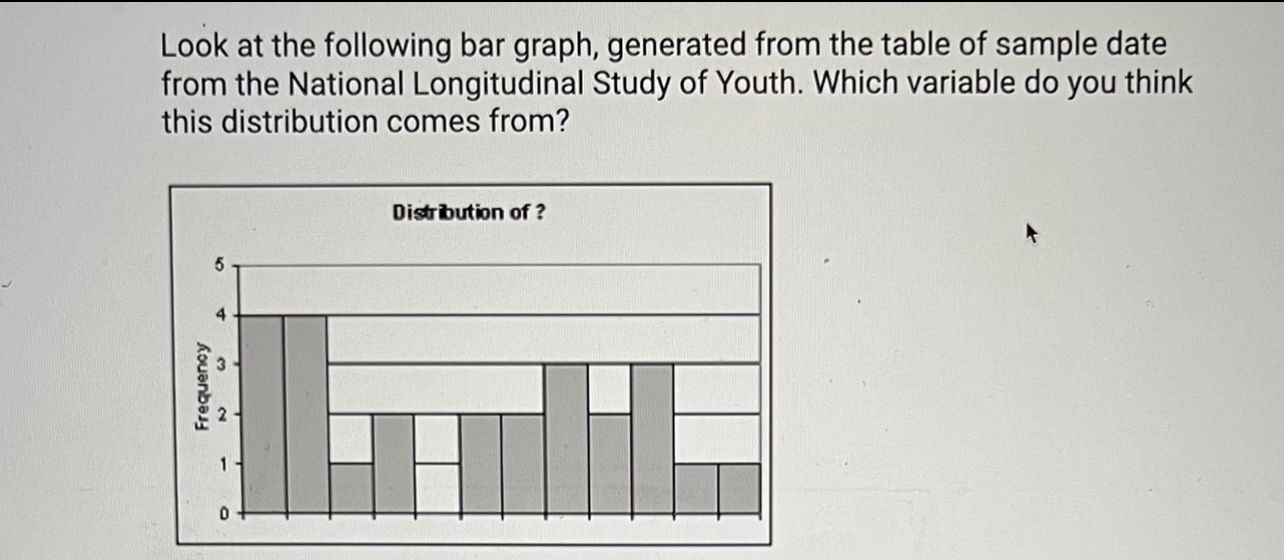
\fLook at the following bar graph, generated from the table of sample date from the National Longitudinal Study of Youth. Which variable do you think this distribution comes from? Distribution of ? Frequency 2 0
Step by Step Solution
There are 3 Steps involved in it
1 Expert Approved Answer
Step: 1 Unlock

Question Has Been Solved by an Expert!
Get step-by-step solutions from verified subject matter experts
Step: 2 Unlock
Step: 3 Unlock