

Question: flow chart digram A firm must choose between two projects A and B, shown below. Their effective income tax rate is 37% and both projects
flow chart digram
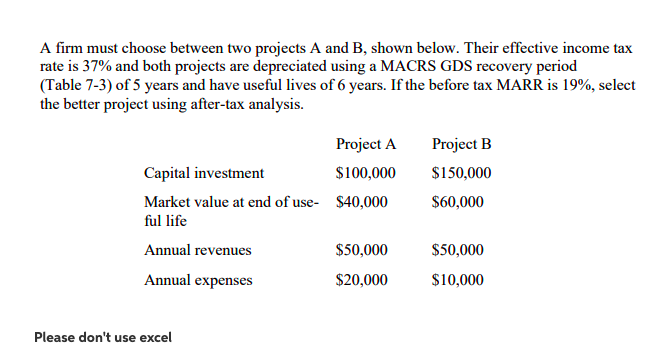
A firm must choose between two projects A and B, shown below. Their effective income tax rate is 37% and both projects are depreciated using a MACRS GDS recovery period (Table 7-3) of 5 years and have useful lives of 6 years. If the before tax MARR is 19%, select the better project using after-tax analysis. Project B $150,000 $60,000 Project A Capital investment $100,000 Market value at end of use- $40,000 ful life Annual revenues $50,000 Annual expenses $20,000 $50,000 $10,000 Please don't use excel
Step by Step Solution
There are 3 Steps involved in it
1 Expert Approved Answer
Step: 1 Unlock

Question Has Been Solved by an Expert!
Get step-by-step solutions from verified subject matter experts
Step: 2 Unlock
Step: 3 Unlock