

Question: Flow chart please 1. Draw a flowchart for the program that will let a teacher enter exactly 5 scores. The programm will output the average
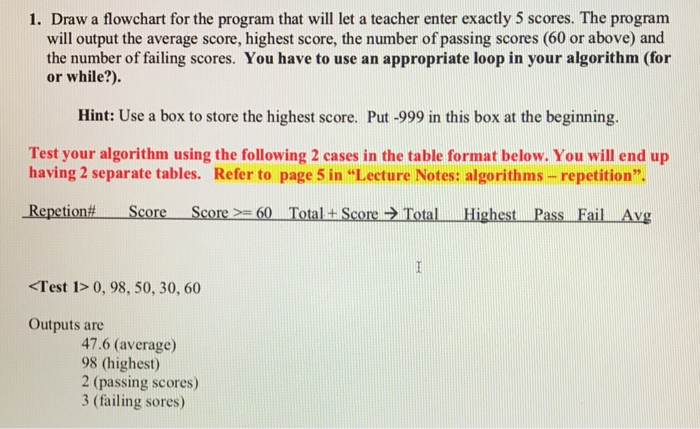
1. Draw a flowchart for the program that will let a teacher enter exactly 5 scores. The programm will output the average score, highest score, the number of passing scores (60 or above) and the number of failing scores. You have to use an appropriate loop in your algorithm (for or while?). Hint: Use a box to store the highest score. Put -999 in this box at the beginning. Test your algorithm using the following 2 cases in the table format below. You will end up having 2 separate tables. Refer to page 5 in "Lecture Notes: algorithms-repetition". Repetion# Score Score >= 60 Total + Score Total Highest Pass Fail Avg
Step by Step Solution
There are 3 Steps involved in it

Get step-by-step solutions from verified subject matter experts