

Question: Fluid dynamics help please Compare these experimental results with theoretical results for the critical drop size at the melting point of rhenium. A well-formatted plot
Fluid dynamics help please
Compare these experimental results with theoretical results for the critical drop size at the melting point of rhenium. A well-formatted plot of the experimental data vs. one or more mathematical models may be an effective way to present the data. Comment on how well the model(s) predict the observed drop size. Calculate and/or comment on any discrepancy between the data provided above and your model(s).
Plot can be a rough estimate
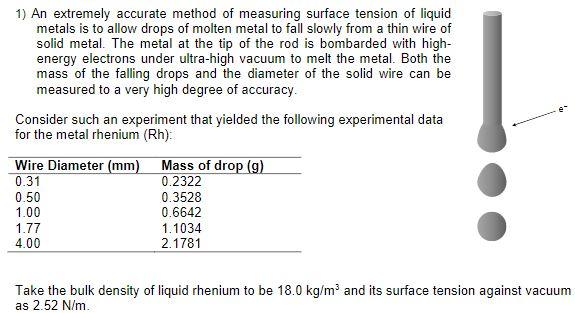
1) An extremely accurate method of measuring surface tension of liquid metals is to allow drops of molten metal to fall slowly from a thin wire of solid metal. The metal at the tip of the rod is bombarded with high- energy electrons under ultra-high vacuum to melt the metal. Both the mass of the falling drops and the diameter of the solid wire can be measured to a very high degree of accuracy. Consider such an experiment that yielded the following experimental data for the metal rhenium (Rh): Wire Diameter (mm) Mass of drop (9) 0.31 0.2322 0.50 0.3528 1.00 0.6642 1.77 1.1034 4.00 2.1781 Take the bulk density of liquid rhenium to be 18.0 kg/m and its surface tension against vacuum as 2.52 N/m
Step by Step Solution
There are 3 Steps involved in it

Get step-by-step solutions from verified subject matter experts