

Question: fluids (Ar, Kr, Xe) lie on the same line when plotted as log P, sal vs. 1/T, and that the line passes through log P,
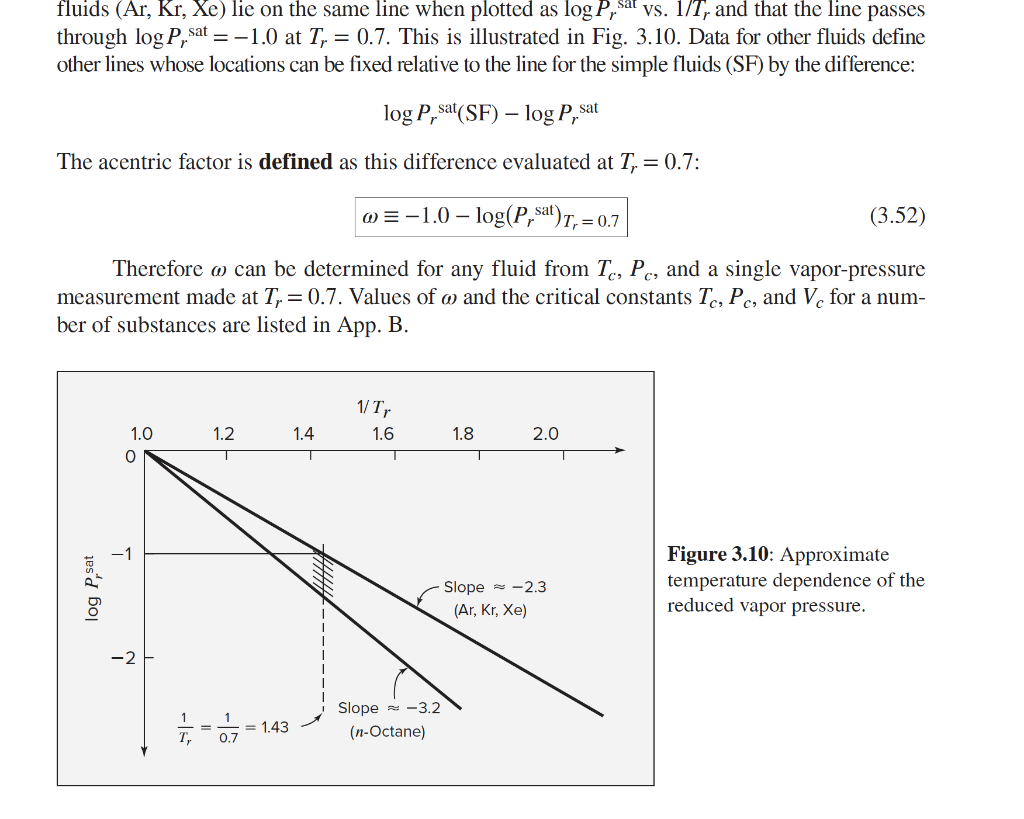
fluids (Ar, Kr, Xe) lie on the same line when plotted as log P, sal vs. 1/T, and that the line passes through log P, sat =-1.0 at T, = 0.7. This is illustrated in Fig. 3.10. Data for other fluids define other lines whose locations can be fixed relative to the line for the simple fluids (SF) by the difference: log P, sat(SF) log P, sat The acentric factor is defined as this difference evaluated at T, = 0.7: @=-1.0 log(P, sat)T, = 0.7 (3.52) Therefore m can be determined for any fluid from Tc, Pc, and a single vapor-pressure measurement made at Ty = 0.7. Values of o and the critical constants Tc, Pc, and V, for a num- ber of substances are listed in App. B. 1/T, 1.6 1.2 1.4 1.8 2.0 1.0 0 -1 log P, sat Slope = -2.3 (Ar, Kr, Xe) Figure 3.10: Approximate temperature dependence of the reduced vapor pressure. -2 - Slope -3.2 (n-Octane) = 1.43 0.7 T, a) Estimate the boiling point (C) of benzene at 19.6 bar using its Pc, Tc, and w. Hint: Figure 3.10 in the textbook will be useful. Find the point representing 19.6 bar on that line. We know two points on the line for benzene: at T = Tc, Pusat = Pc when 1/Tr= 1, log (Prsat) = 0; and the other point is based on the definition of w. = *If you want to get ahead to parts b) to e): the boiling point at 19.6 bar is approximately 219.6C.* b) Estimate the molar volume of benzene as saturated vapor at 19.6 bar using the generalized correlation and the Lee-Kessler tables. c) Estimate the molar volume of benzene as saturated vapor at 19.6 bar using the generalized correlation and the correlation for 2nd virial coefficient. d) Estimate the molar volume of benzene as saturated vapor at 19.6 bar using the Soave- Redlich-Kwong model. e) Compare the answers you get in parts b), c), and d) as well as the prediction using ideal gas law
Step by Step Solution
There are 3 Steps involved in it

Get step-by-step solutions from verified subject matter experts