

Question: fnew table 5 A Q Search +) v APPENDIX B B ABLE 5 Critical Values of the x2 Distribution A x2 Degrees of X'-025 X-010
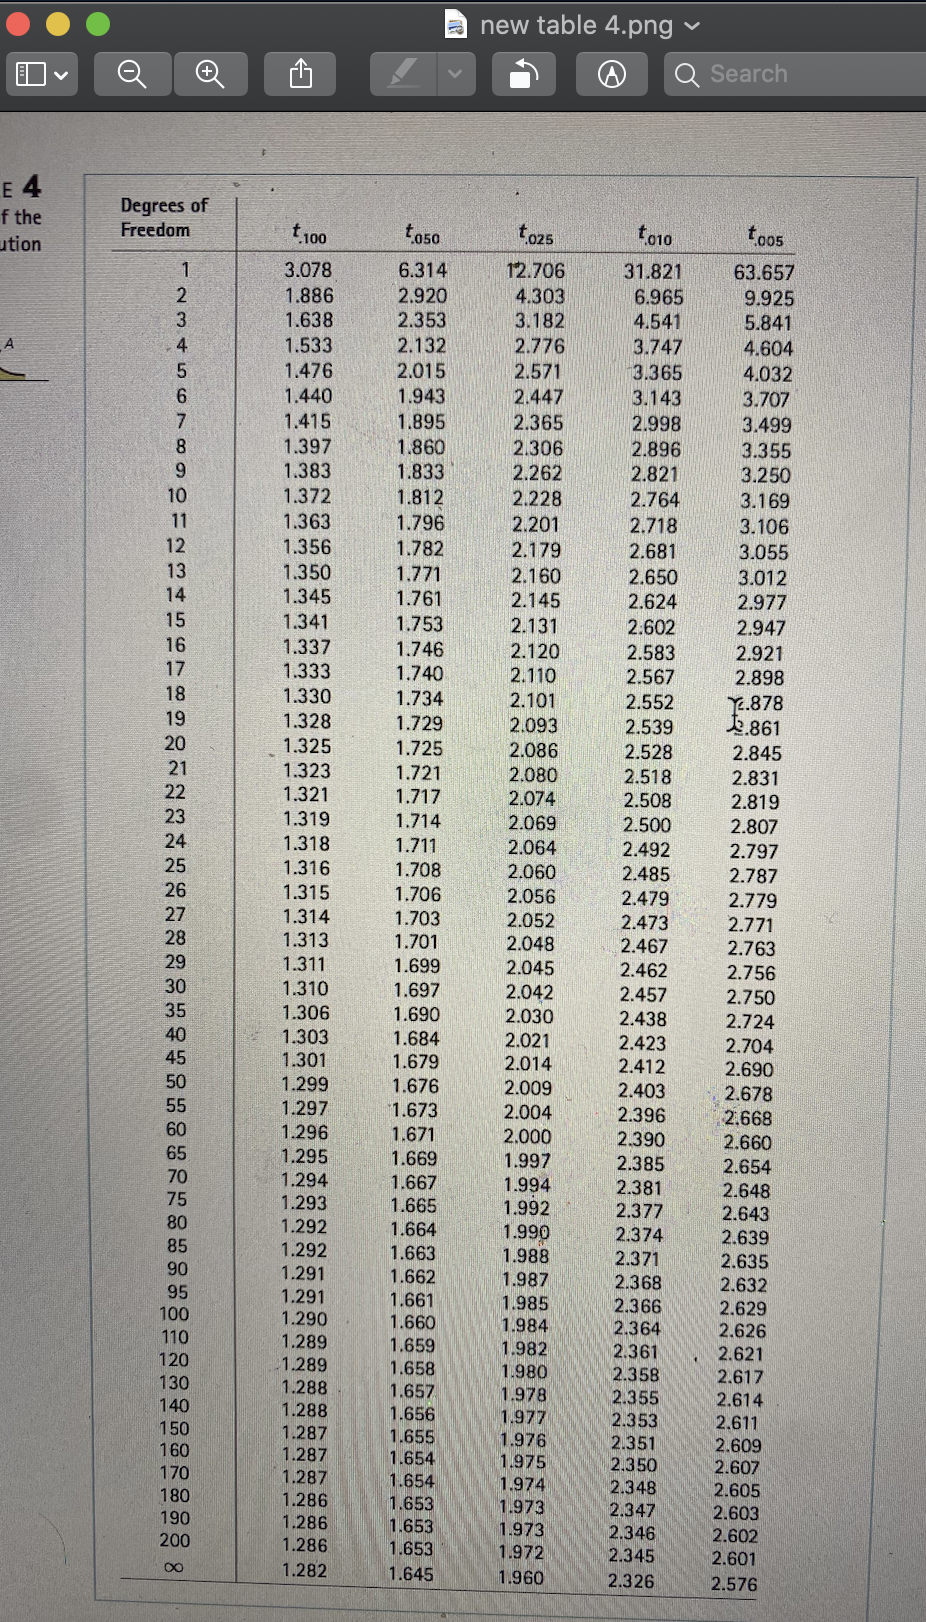
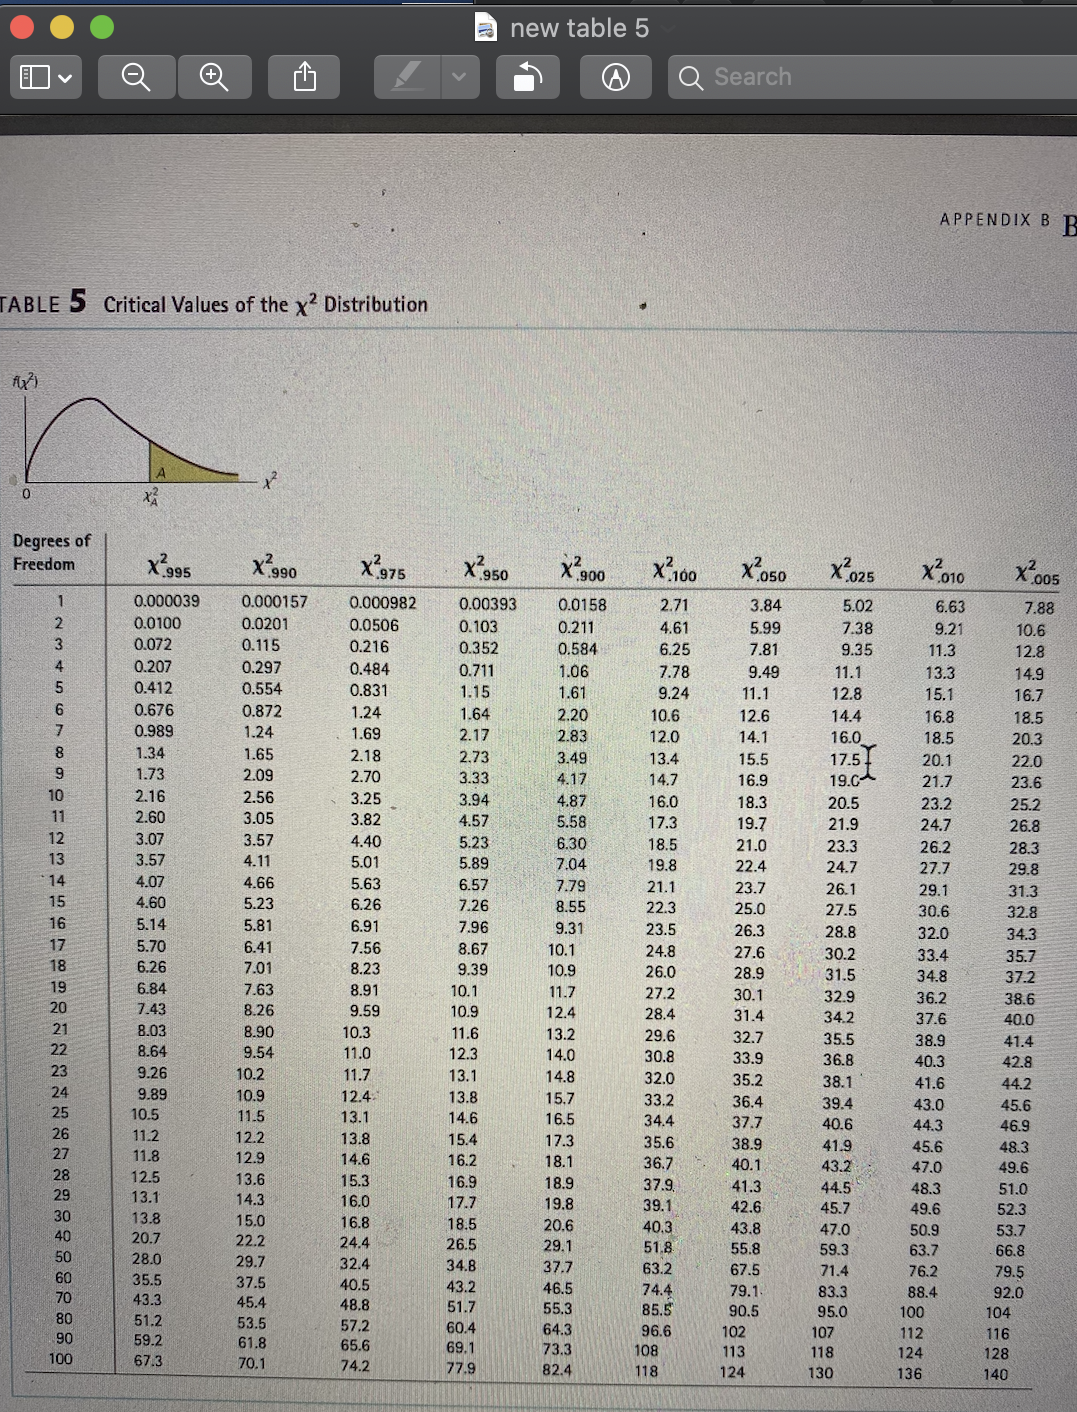
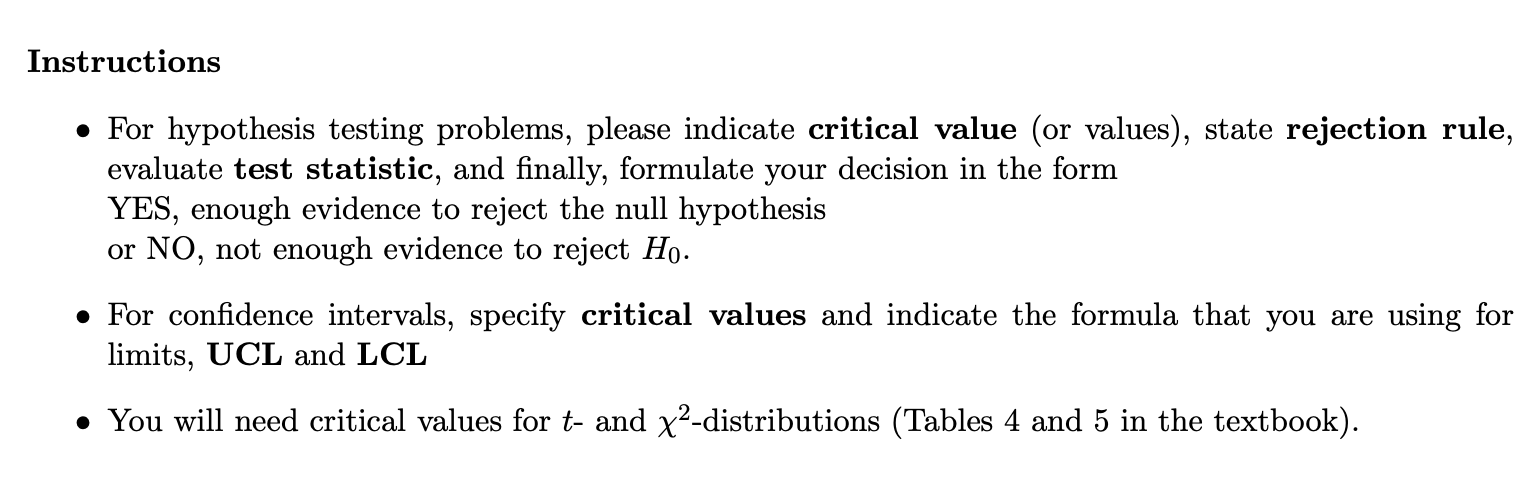
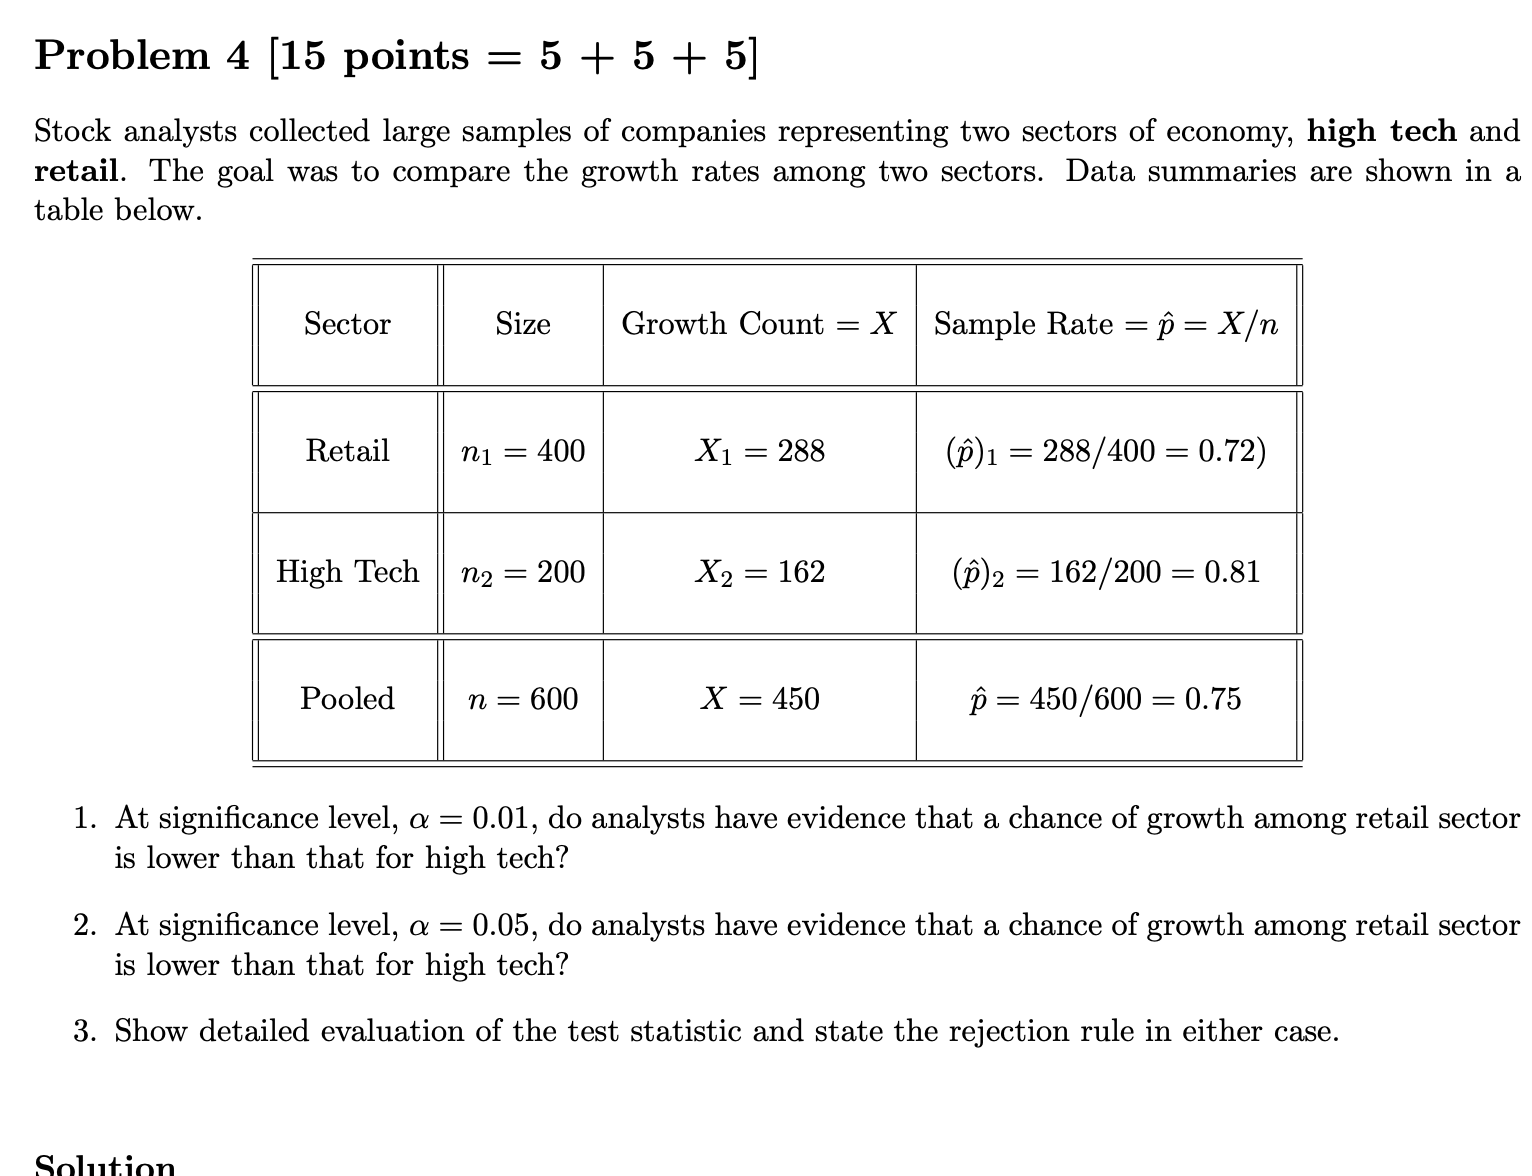
\fnew table 5 A Q Search +) v APPENDIX B B ABLE 5 Critical Values of the x2 Distribution A x2 Degrees of X'-025 X-010 X-005 Freedom X-995 X-990 X-975 X-950 X-900 X-100 X:050 0.0158 2.71 3.84 5.02 6.63 7.88 0.000039 0.000157 0.000982 0.00393 0.0201 0.0506 0.103 0.211 4.61 5.99 7.38 9.21 10.6 0.0100 0.352 0.584 6.25 7.81 9.35 11.3 12.8 0.072 0.115 0.216 7.78 9.49 11.1 13.3 14.9 0.207 0.29 0.484 0.711 1.06 12.8 15.1 16.7 0.412 0.554 0.831 1.15 1.61 9.24 11.1 12.6 14.4 16.8 18.5 0.676 0.872 1.24 1.64 2.20 10.6 1.69 2.17 2.83 12.0 14.1 16.0 18.5 20.3 0.989 1.24 20.1 22.0 1.34 1.65 2.18 2.73 3.49 13.4 15.5 17.5 2.09 2.70 3.33 4.17 14.7 16.9 19.C- 21.7 23.6 1.73 16.0 18.3 20.5 23.2 25.2 2.16 2.56 3.25 3.94 4.87 5.58 17.3 19.7 21.9 24.7 26.8 2.60 3.05 3.82 4.57 18.5 21.0 23.3 26.2 28.3 6.30 12 3.07 3.57 4.40 5.23 5.01 5.89 7.04 19.8 22.4 24.7 27.7 29.8 13 3.57 4.11 21.1 23.7 26.1 29.1 31.3 14 4.07 4.66 5.63 6.57 7.79 32.8 15 4.60 5.23 6.26 7.26 8.55 22.3 25.0 27.5 30.6 6.91 7.96 9.31 23.5 26.3 28.8 32.0 34.3 16 5.14 5.81 35.7 5.70 6.41 7.56 8.67 10.1 24.8 27.6 30.2 33.4 34.8 37.2 6.26 7.01 8.23 9.39 10.9 26.0 28.9 31.5 10.1 11.7 27.2 30.1 32.9 36.2 38.6 6.84 7.63 8.91 10.9 12.4 28.4 31.4 34.2 37.6 40.0 20 7.43 8.26 9.59 41.4 8.03 8.90 10.3 11.6 13.2 29.6 32.7 35.5 38.9 11.0 12.3 14.0 30.8 33.9 36.8 40.3 42.8 8.64 9.54 38.1 41.6 44.2 23 9.26 10.2 11.7 13.1 14.8 32.0 35.2 15,7 33.2 36.4 39.4 43.0 45.6 24 9.89 10.9 12.4 13.8 37.7 40.6 44.3 46.9 25 10.5 11.5 13.1 14.6 16.5 34.4 13.8 15.4 17.3 35.6 38.9 41.9 45.6 48.3 26 11.2 12.2 27 12.9 16.2 18.1 36.7 40.1 43.2 47.0 49.6 11.8 14.6 48.3 51.0 28 12.5 13.6 15.3 16.9 18.9 37.9. 41.3 44.5 16.0 17.7 19.8 39.1 42.6 45.7 49.6 52.3 13.1 14.3 15.0 18.5 20.6 40.3 43.8 47.0 50.9 53.7 13.8 16.8 29.1 51.8 55.8 59.3 63.7 66.8 20.7 22.2 24.4 26.5 $4.8 63.2 67.5 71.4 76.2 79.5 28.0 29.7 32.4 37.7 92.0 35.5 37.5 40.5 43.2 46.5 74.4 79.1 83.3 88.4 8883868 95.0 100 104 43.3 45.4 48.8 51.7 55.3 85.5 90.5 51.2 53.5 60.4 64.3 96.6 102 107 112 116 57.2 124 128 59.2 61.8 65.6 69.1 73.3 108 113 118 136 67.3 130 140 70.1 74.2 77.9 82.4 118 124Instruct ions 0 For hypothesis testing problems, please indicate critical value (or values), state rejection rule, evaluate test statistic, and nally, formulate your decision in the form YES, enough evidence to reject the null hypothesis or NO, not enough evidence to reject H0. 0 For condence intervals, specify critical values and indicate the formula that you are using for limits, UCL and LCL 0 You Will need critical values for t and x2-distributions (Tables 4 and 5 in the textbook). Problem 4 [15 points = 5 + 5 + 5] Stock analysts collected large samples of companies representing two sectors of economy, high tech and retail. The goal was to compare the growth rates among two sectors. Data summaries are shown in a table below. Sector Size Growth Count = X Sample Rate = p = X Retail n1 = 400 X1 = 288 (P)1 = 288/400 = 0.72) High Tech n2 = 200 X2 = 162 (p)2 = 162/200 = 0.81 Pooled n = 600 X = 450 p = 450/600 = 0.75 1. At significance level, a = 0.01, do analysts have evidence that a chance of growth among retail sector is lower than that for high tech? 2. At significance level, a = 0.05, do analysts have evidence that a chance of growth among retail sector is lower than that for high tech? 3. Show detailed evaluation of the test statistic and state the rejection rule in either case
Step by Step Solution
There are 3 Steps involved in it

Get step-by-step solutions from verified subject matter experts