

Question: follow directions to answer question based on the sheet given below ANOVA Summary Table from questions 2-4. Fill in the values that you calculated. (5
follow directions to answer question based on the sheet given below
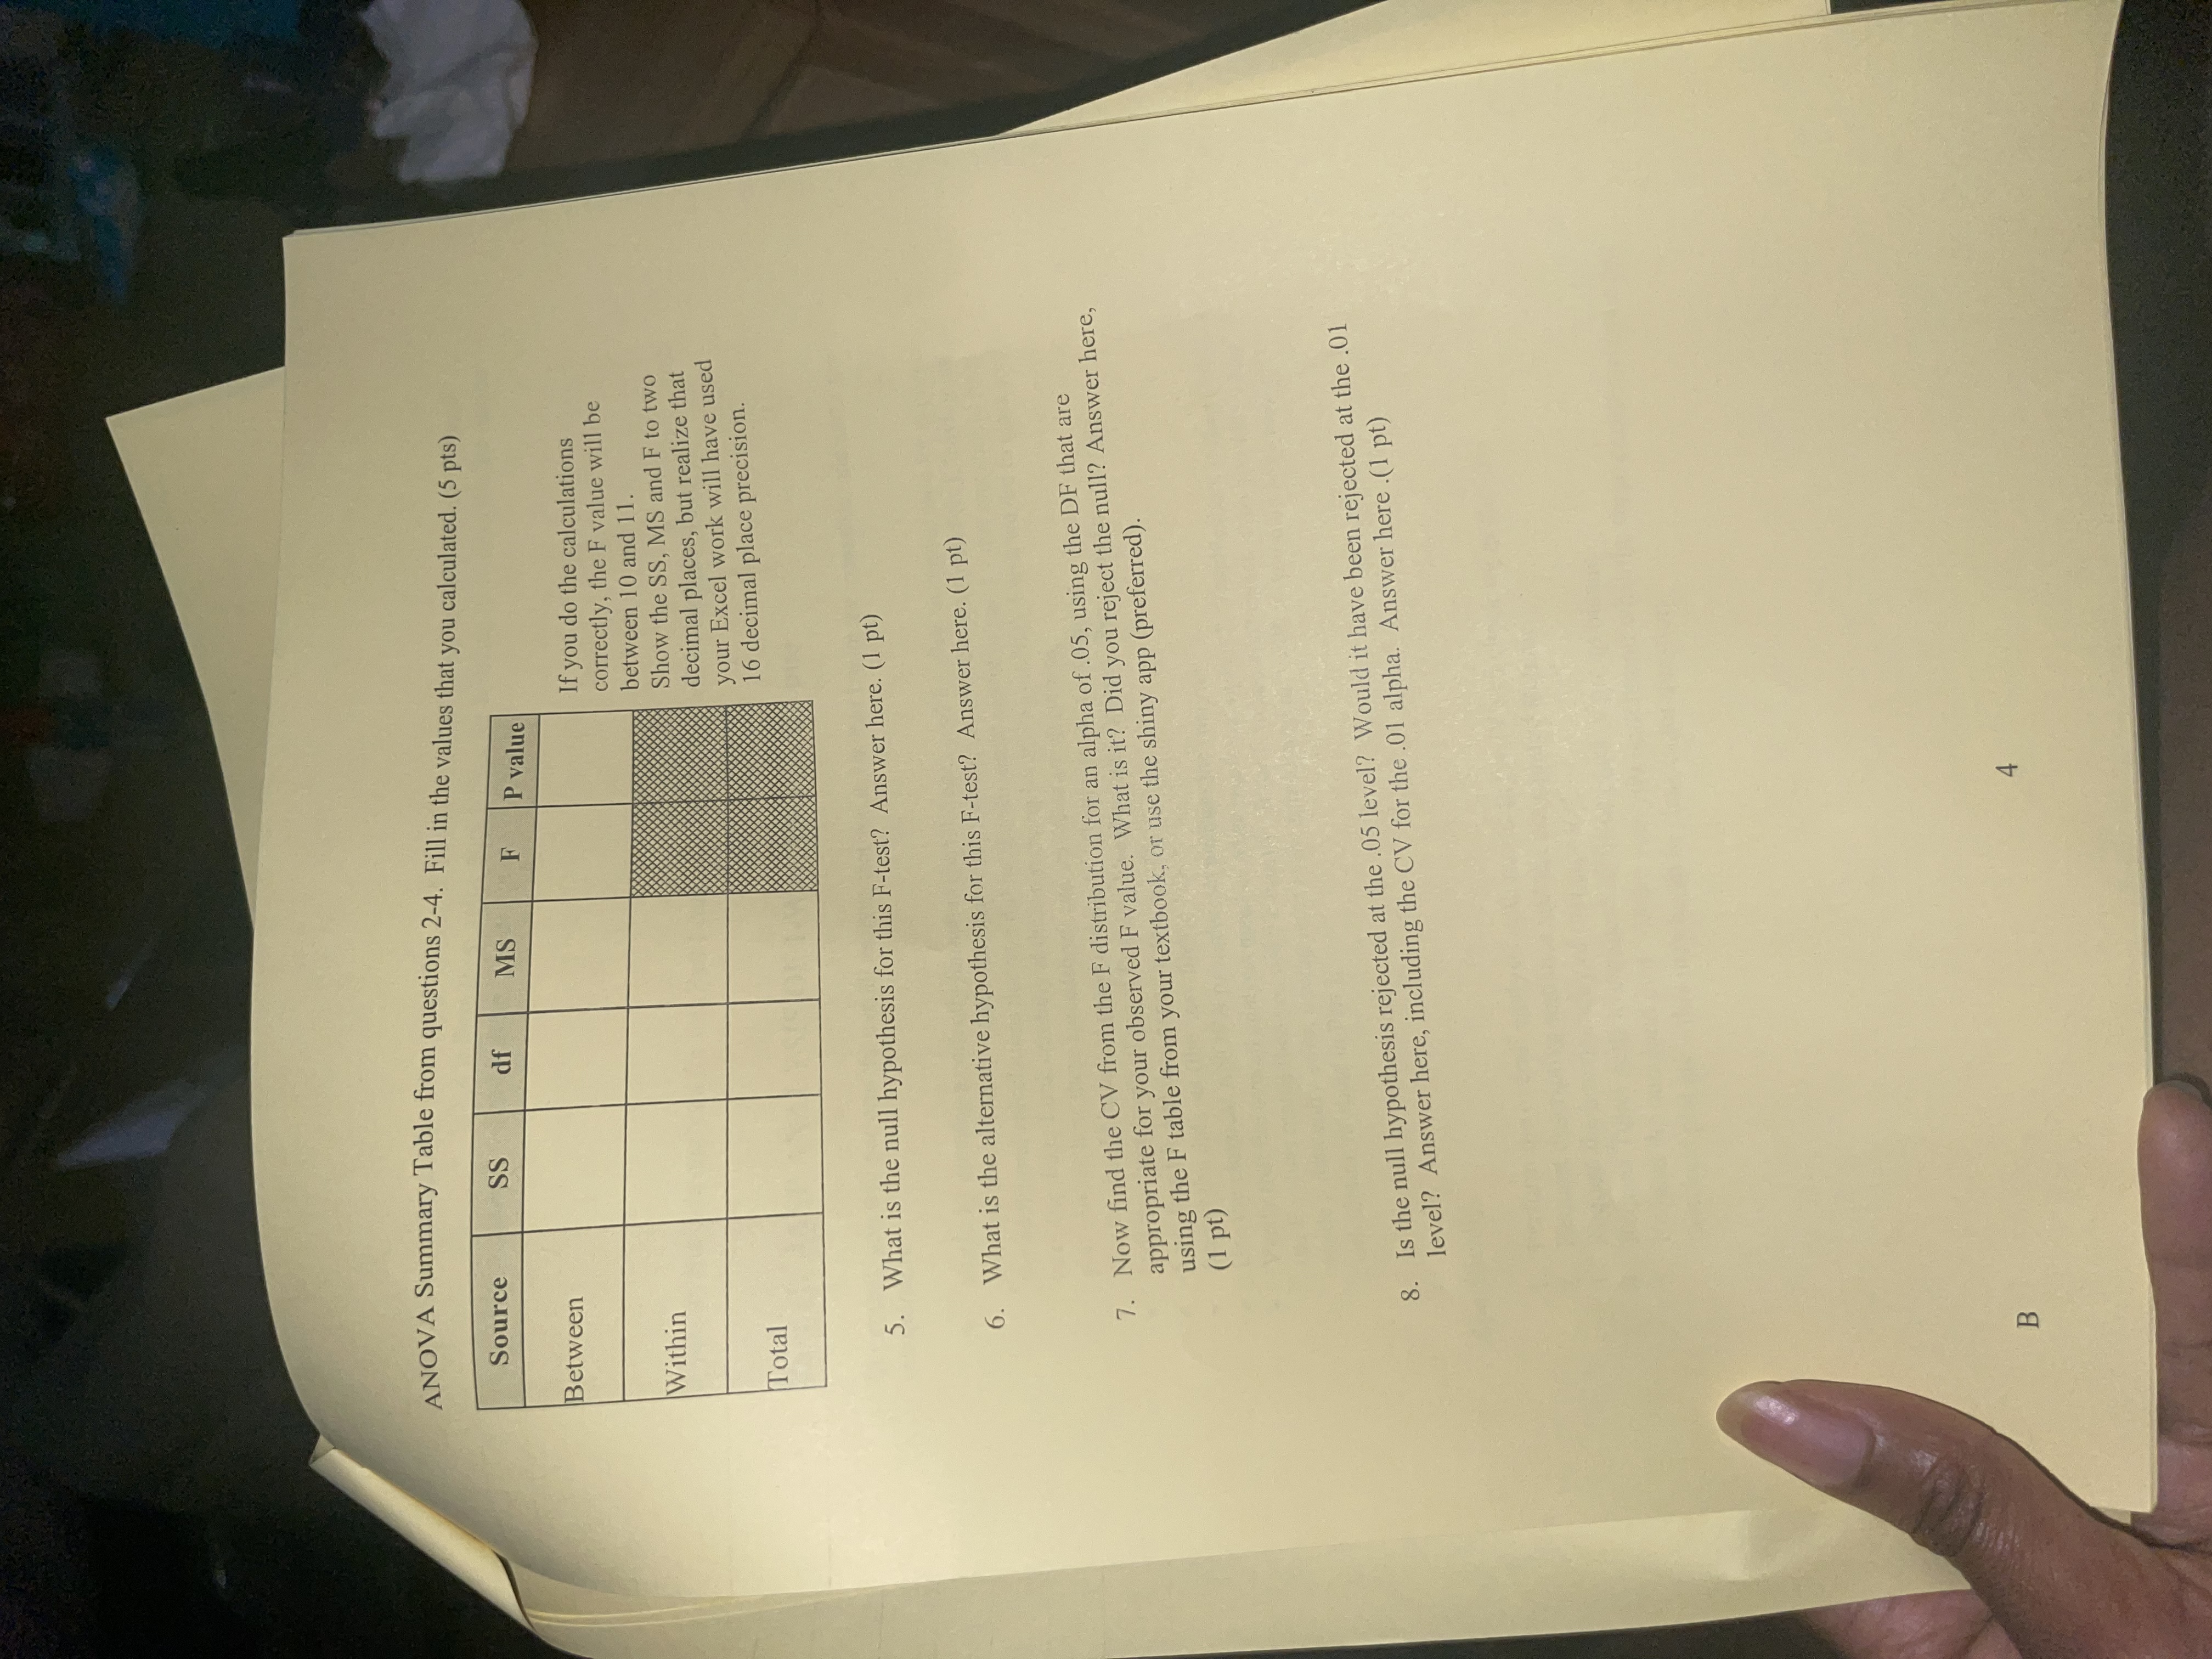
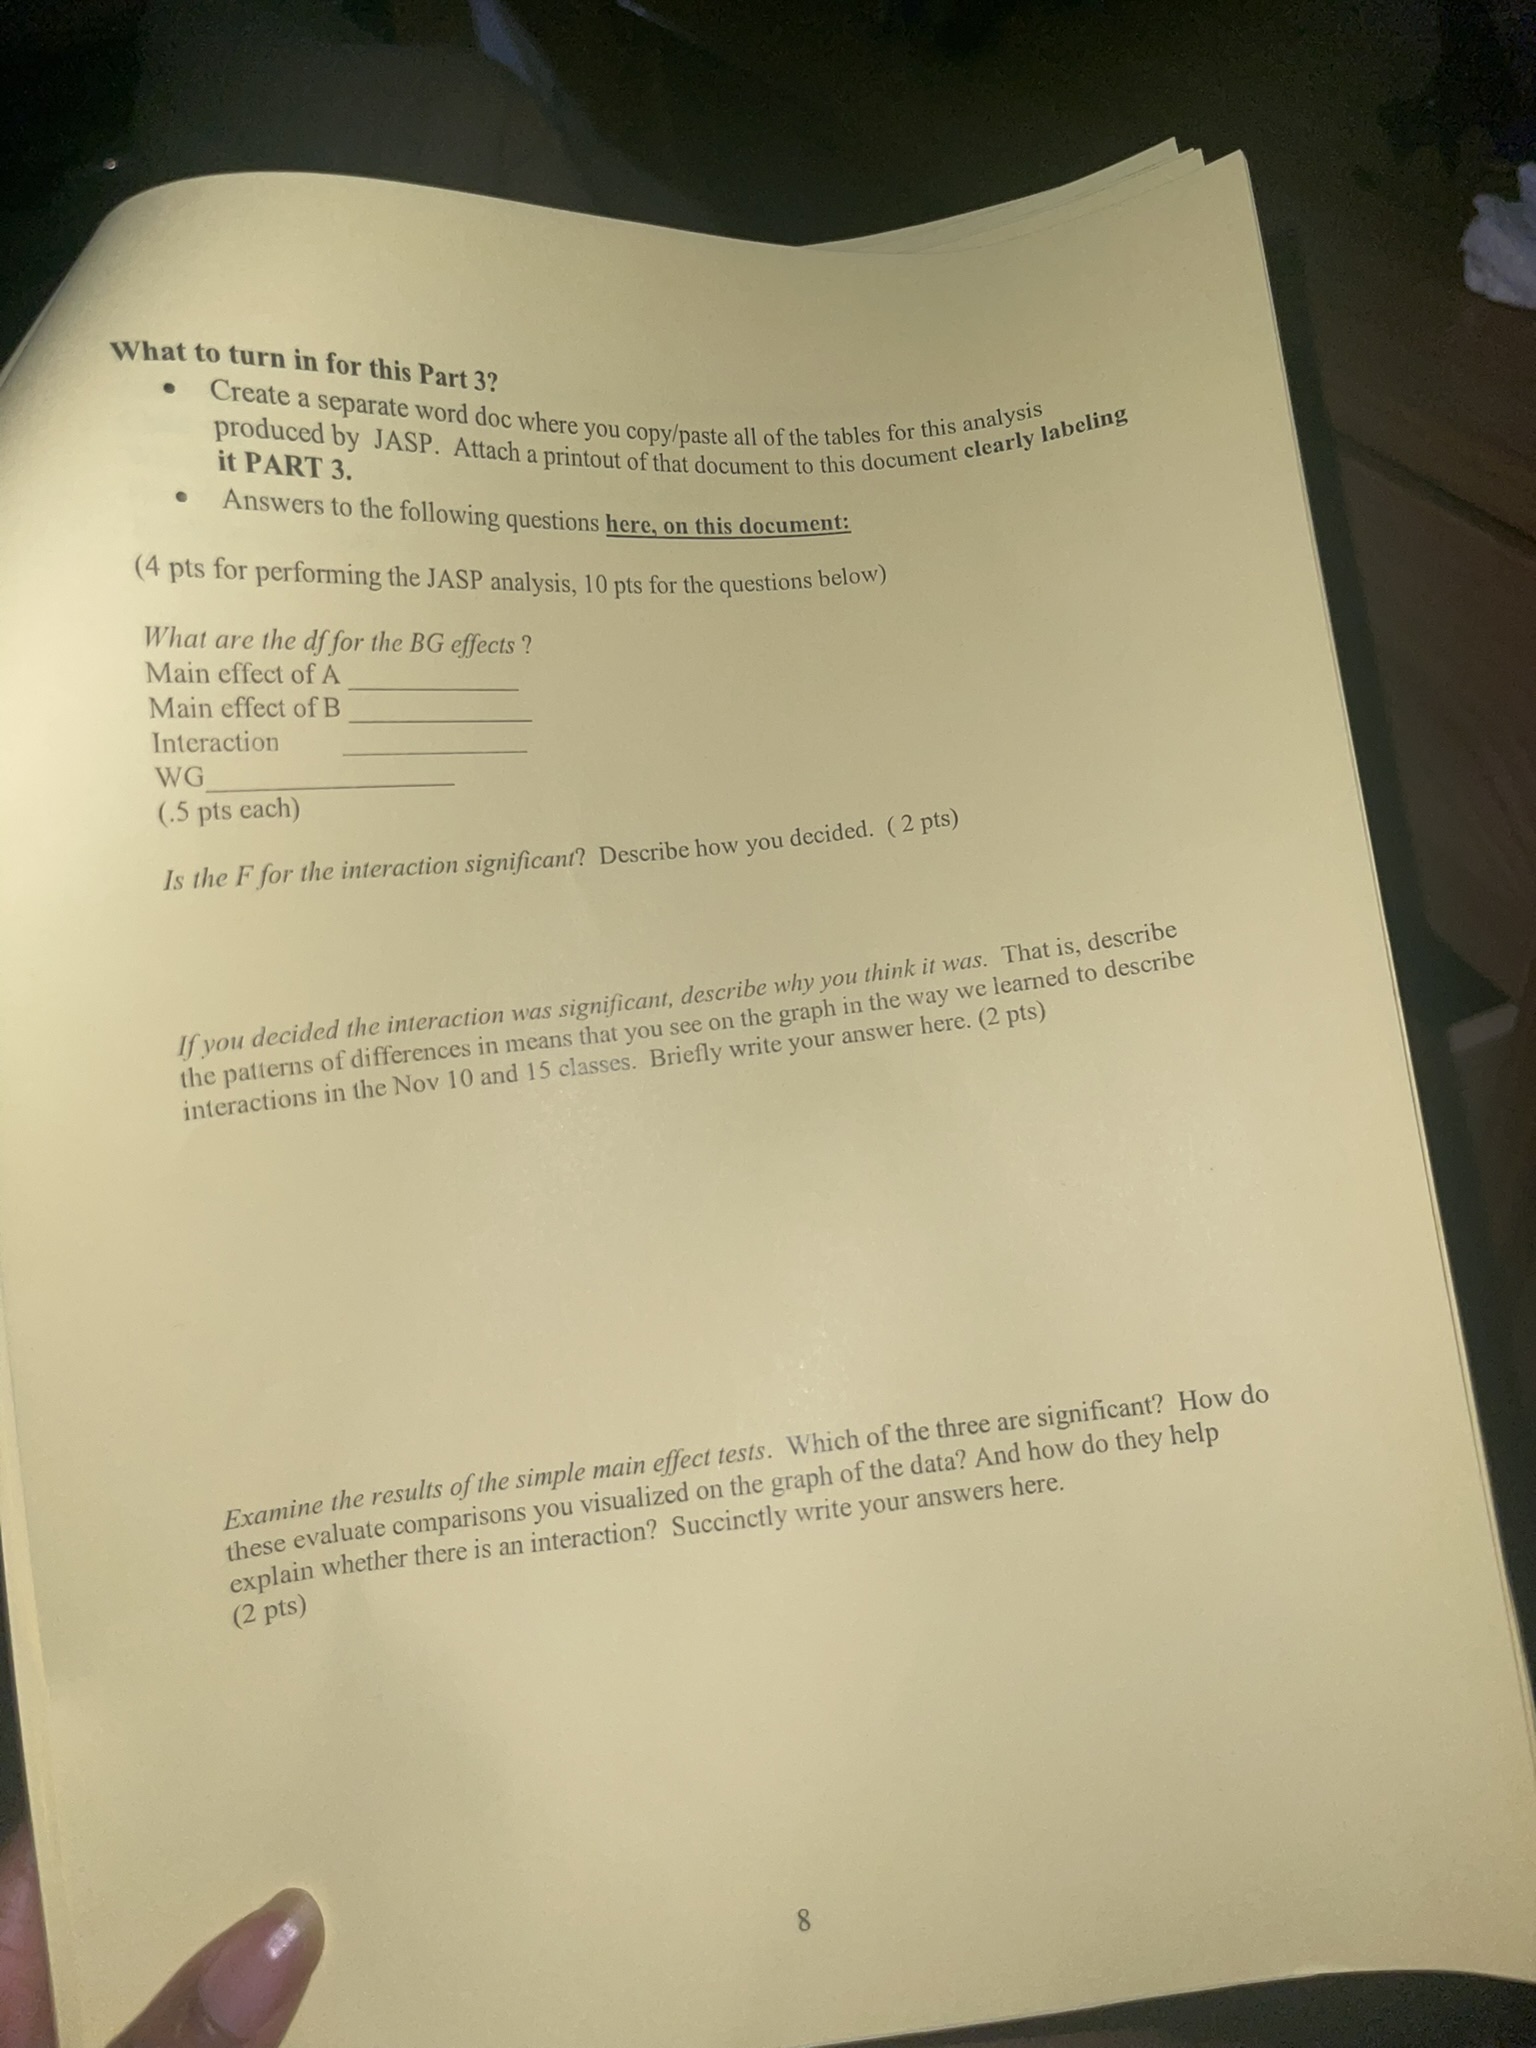
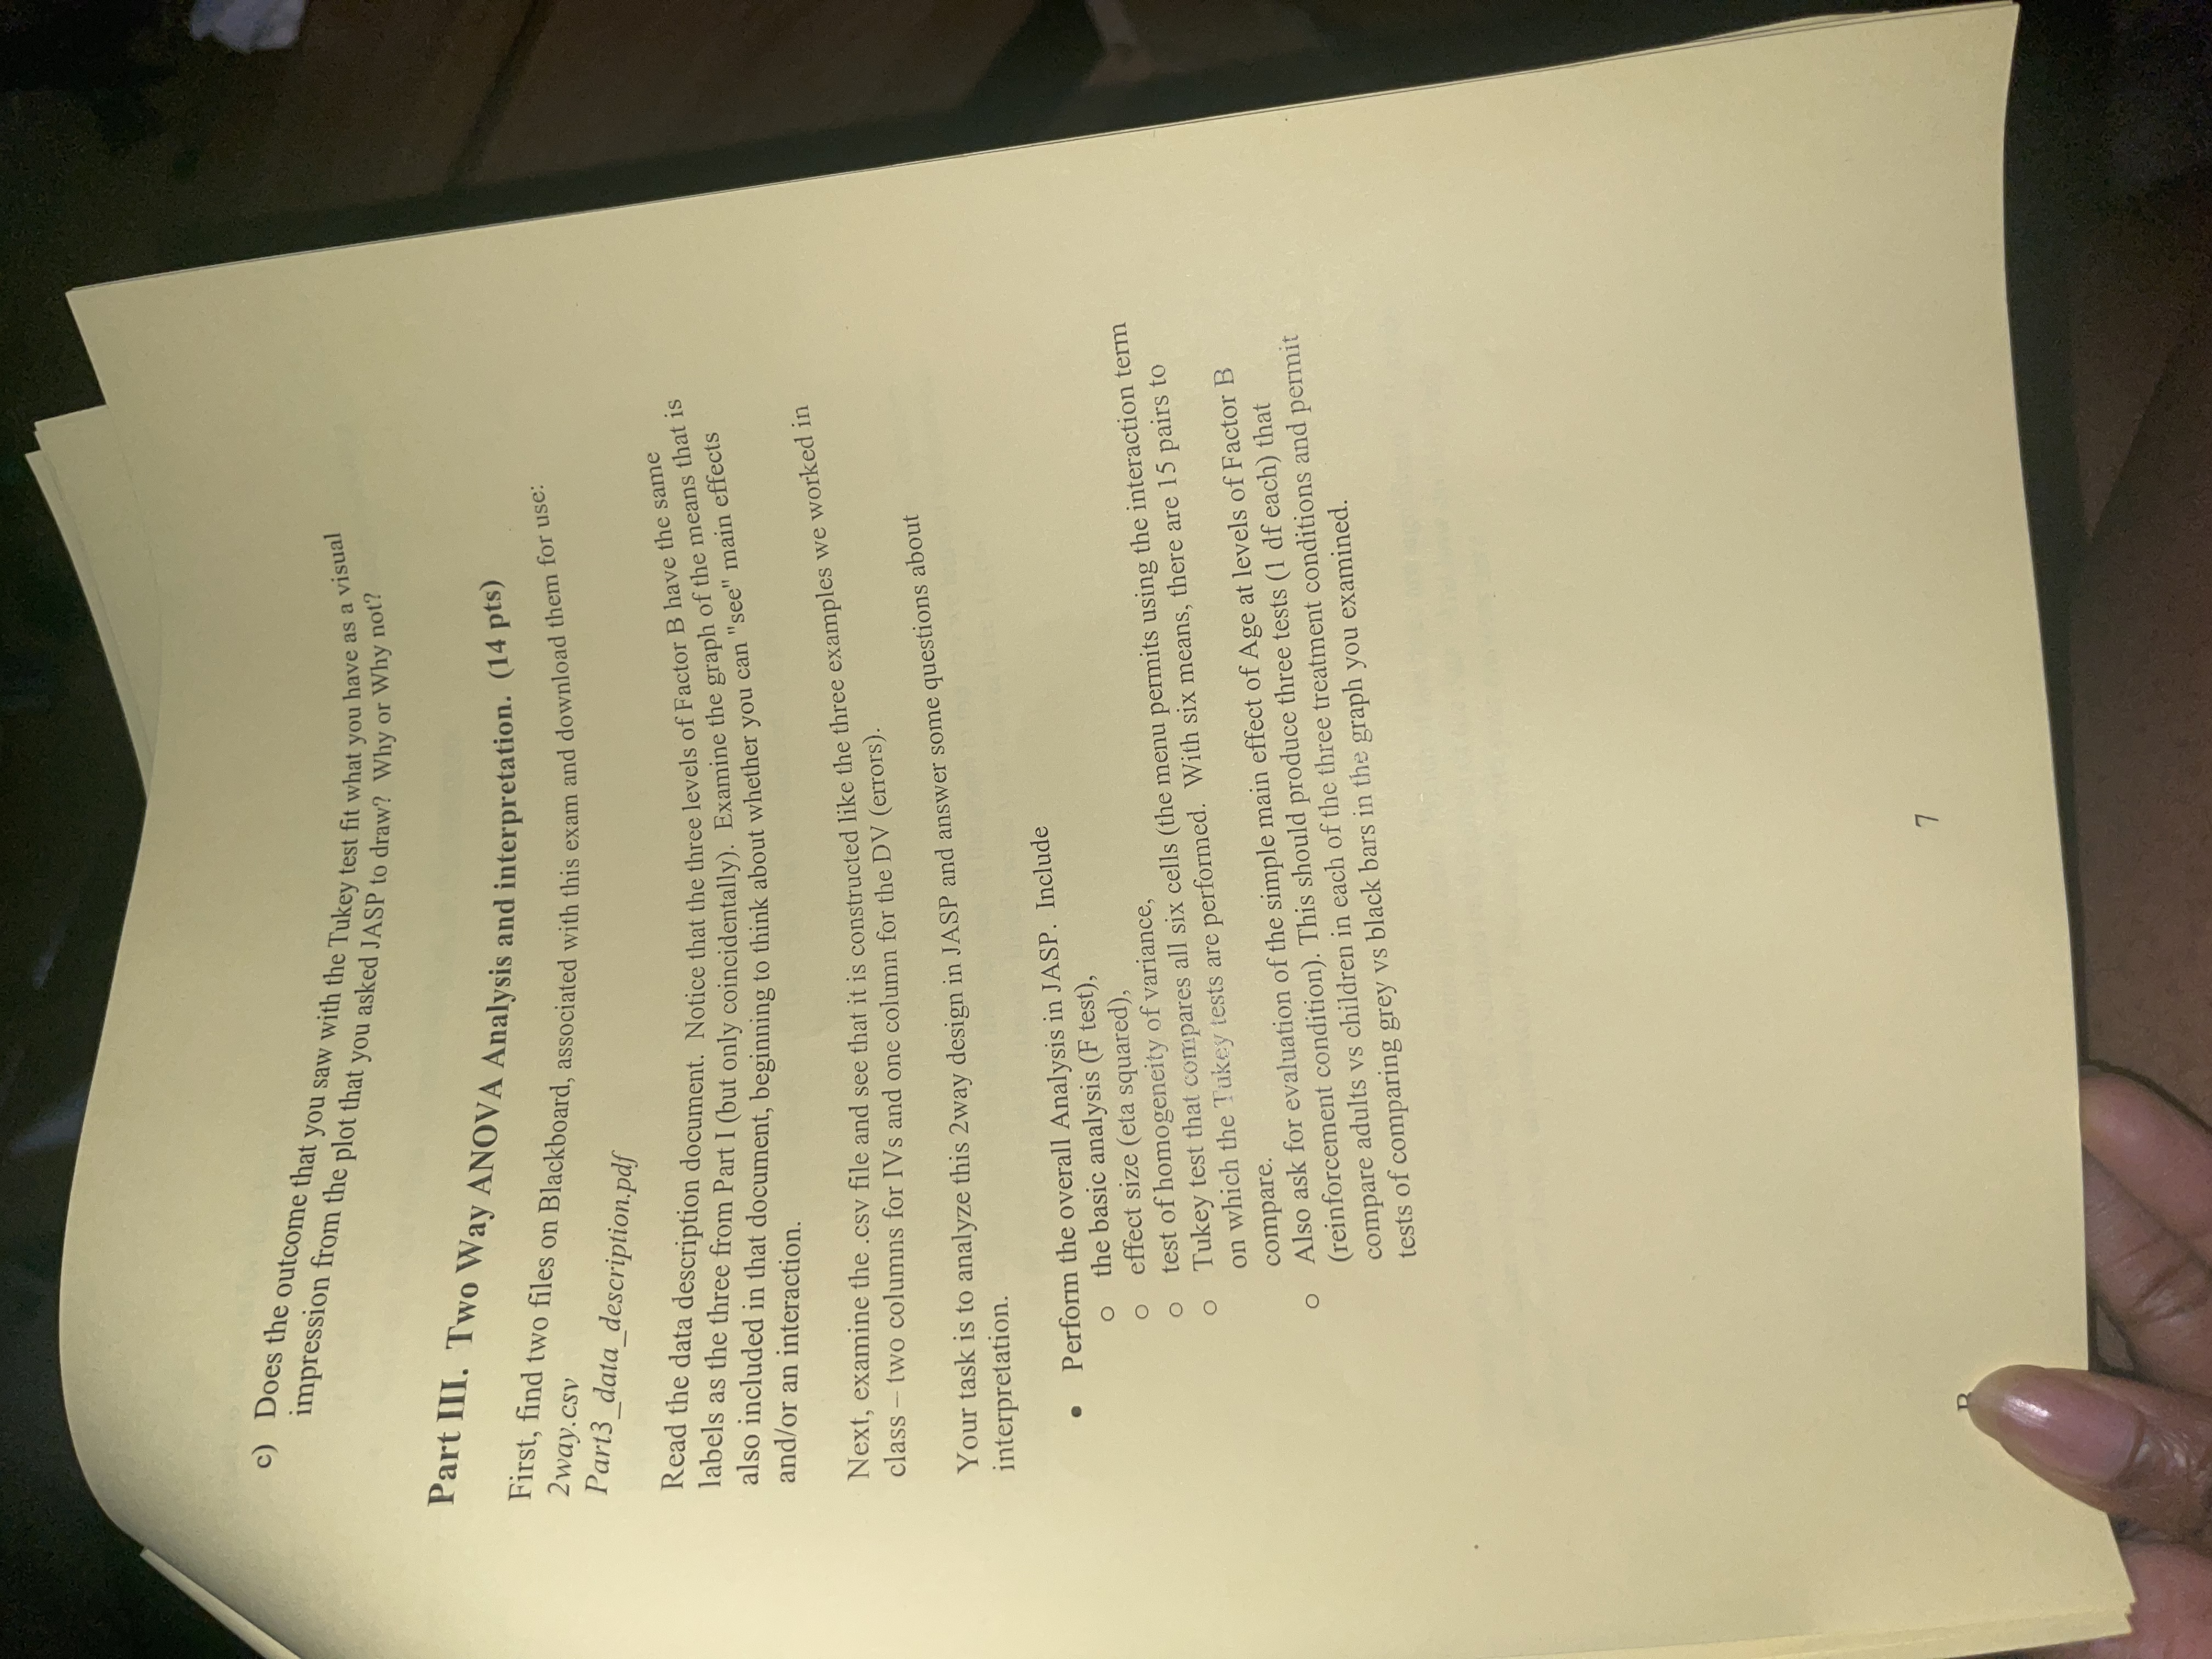
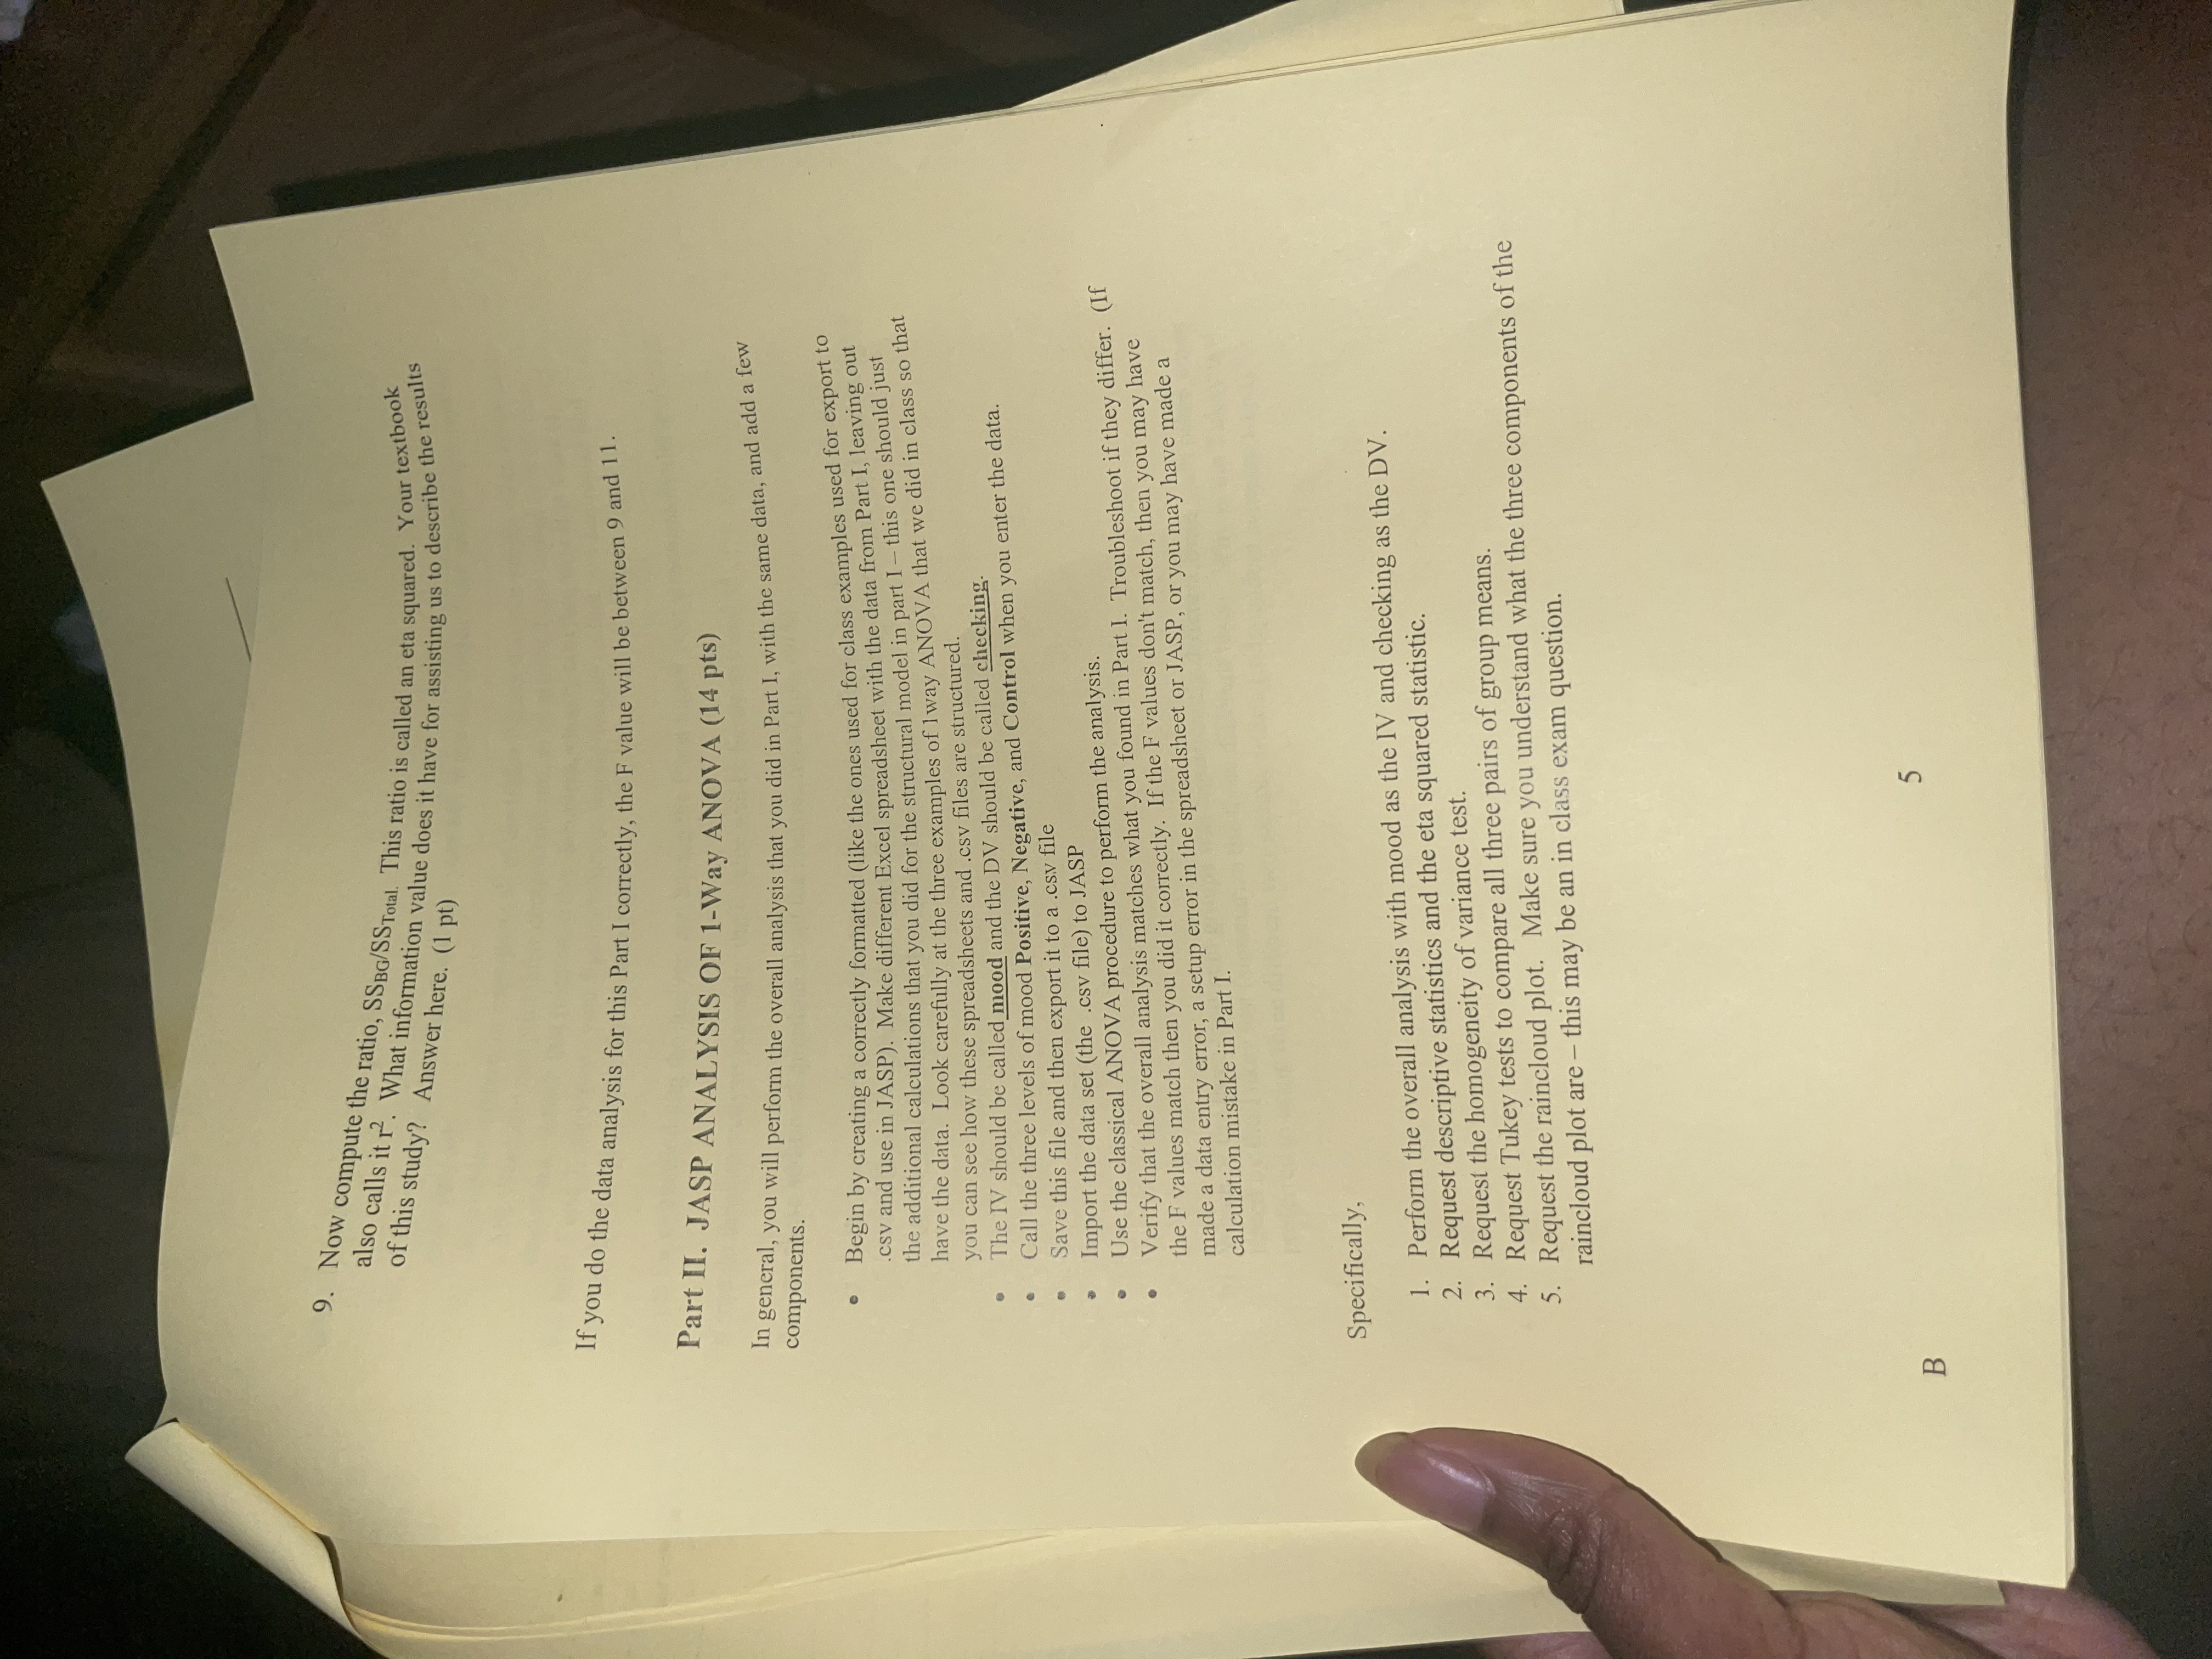
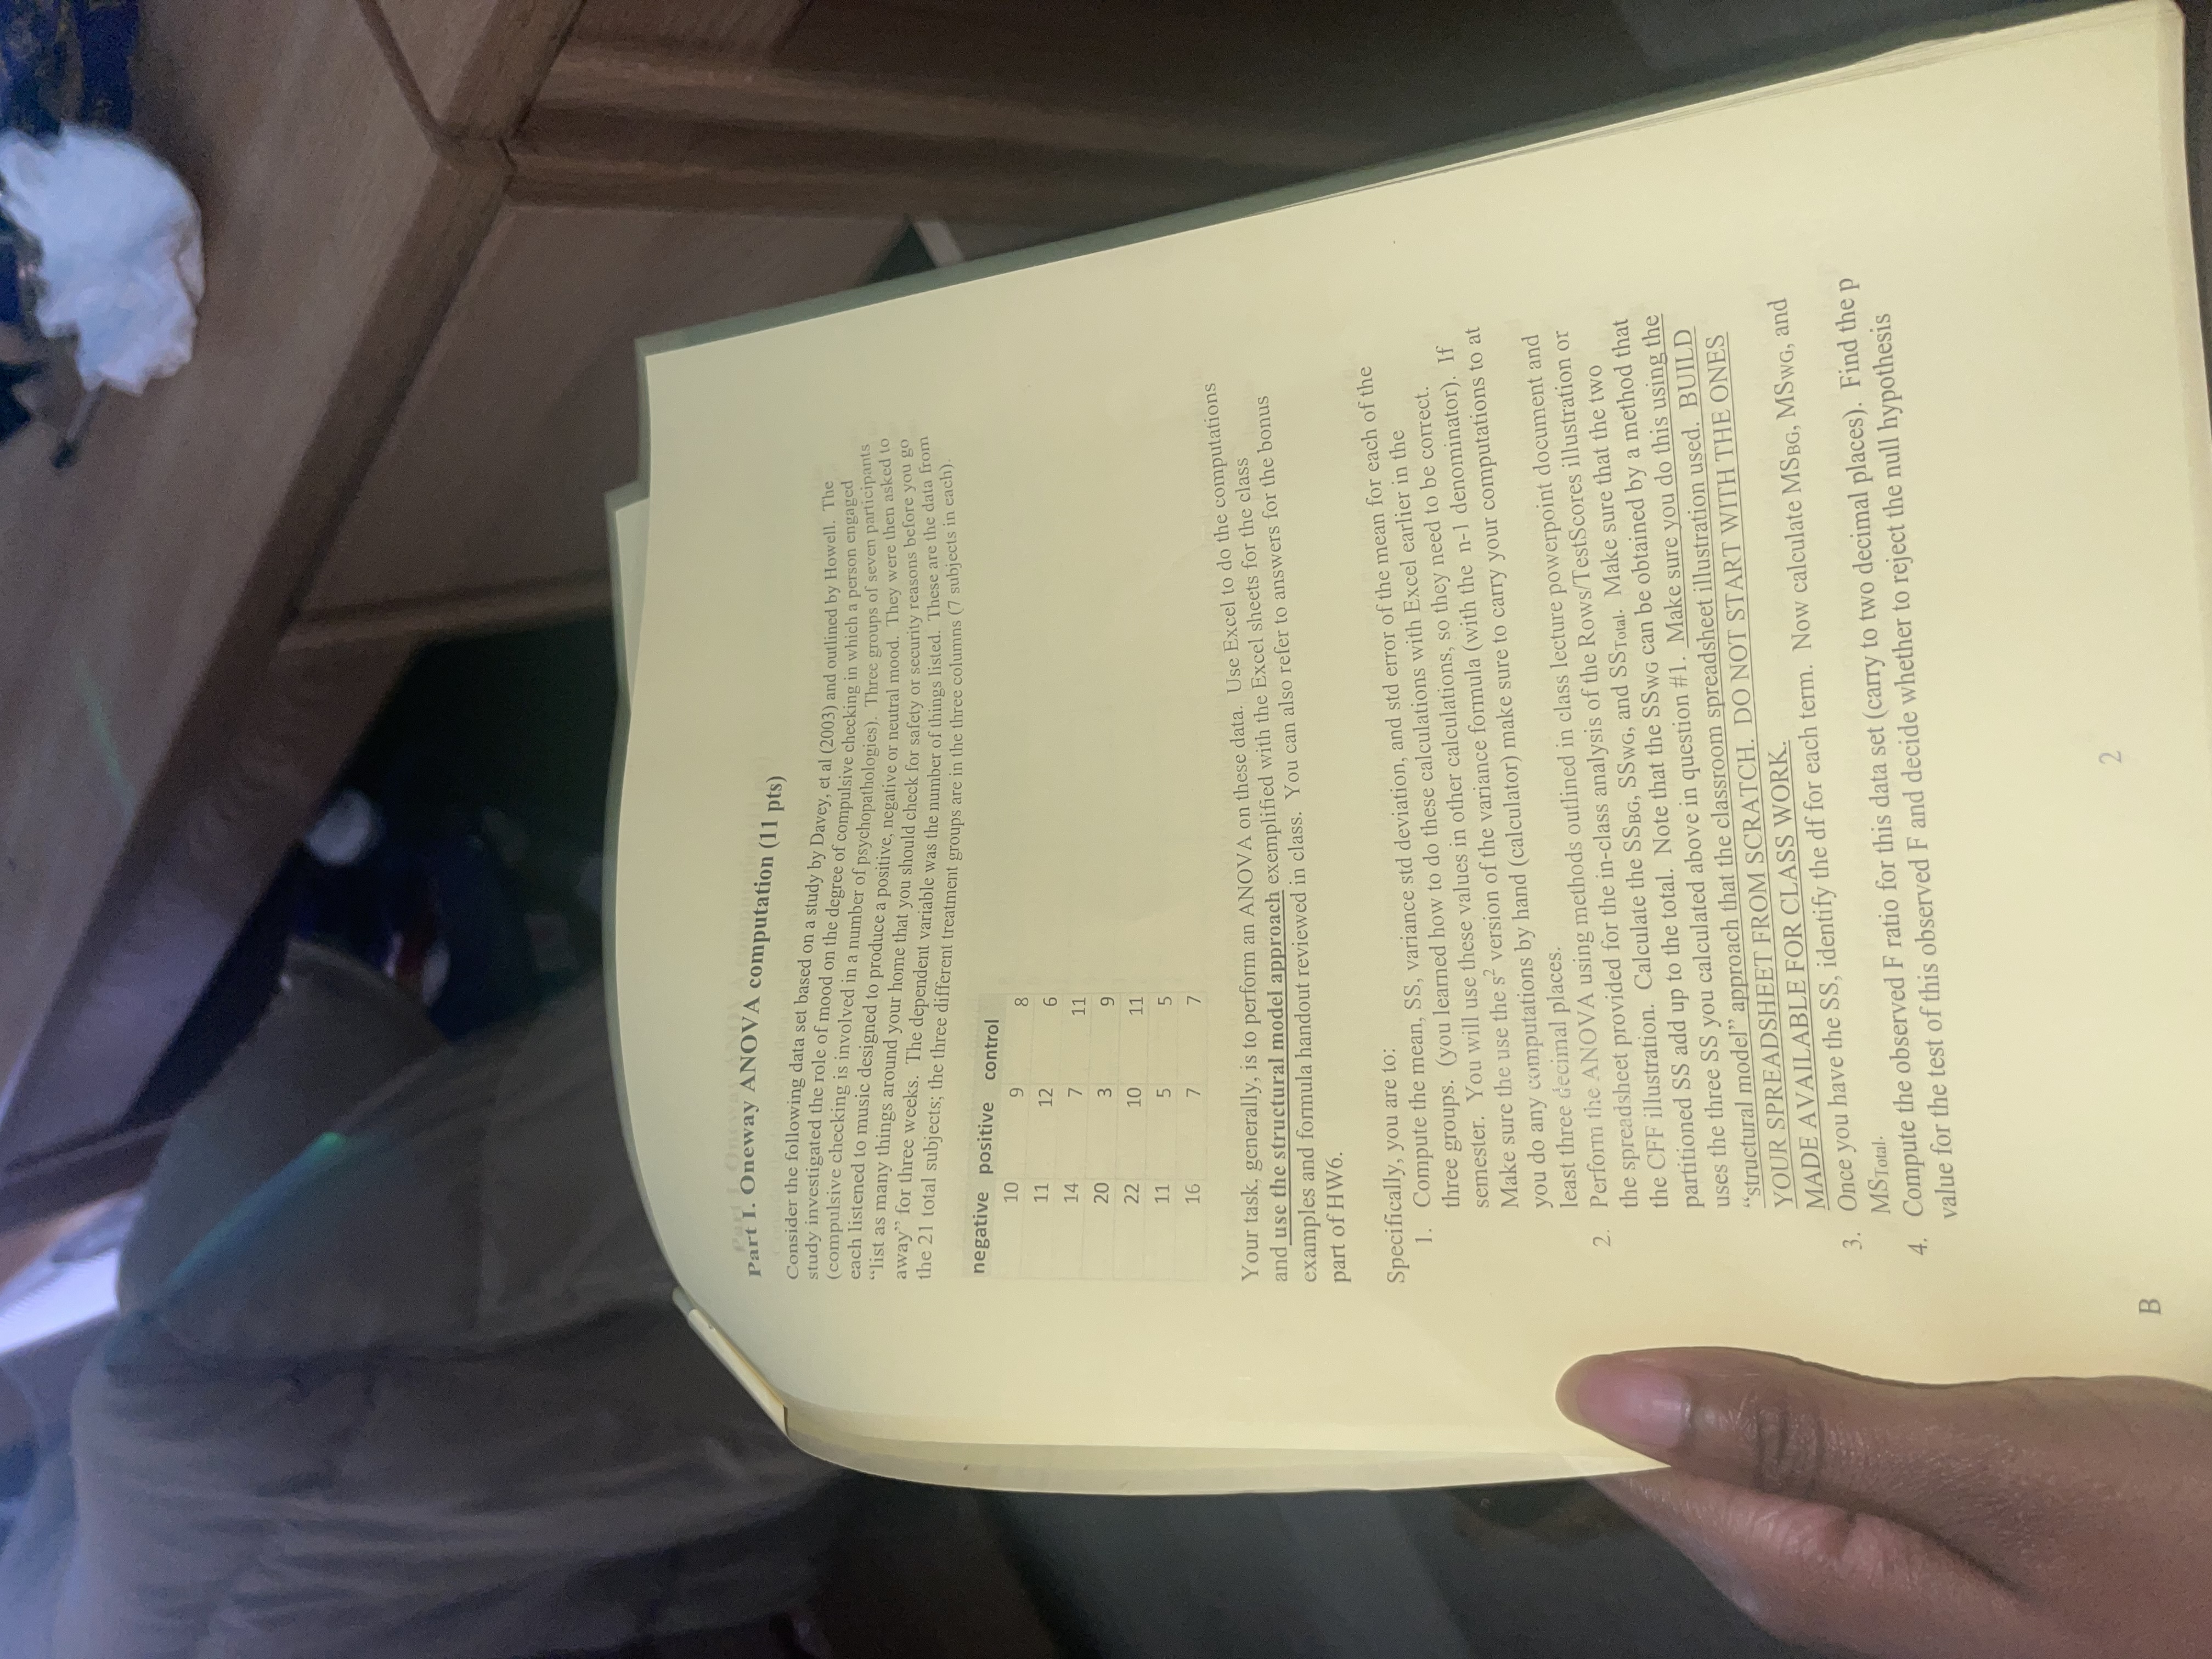
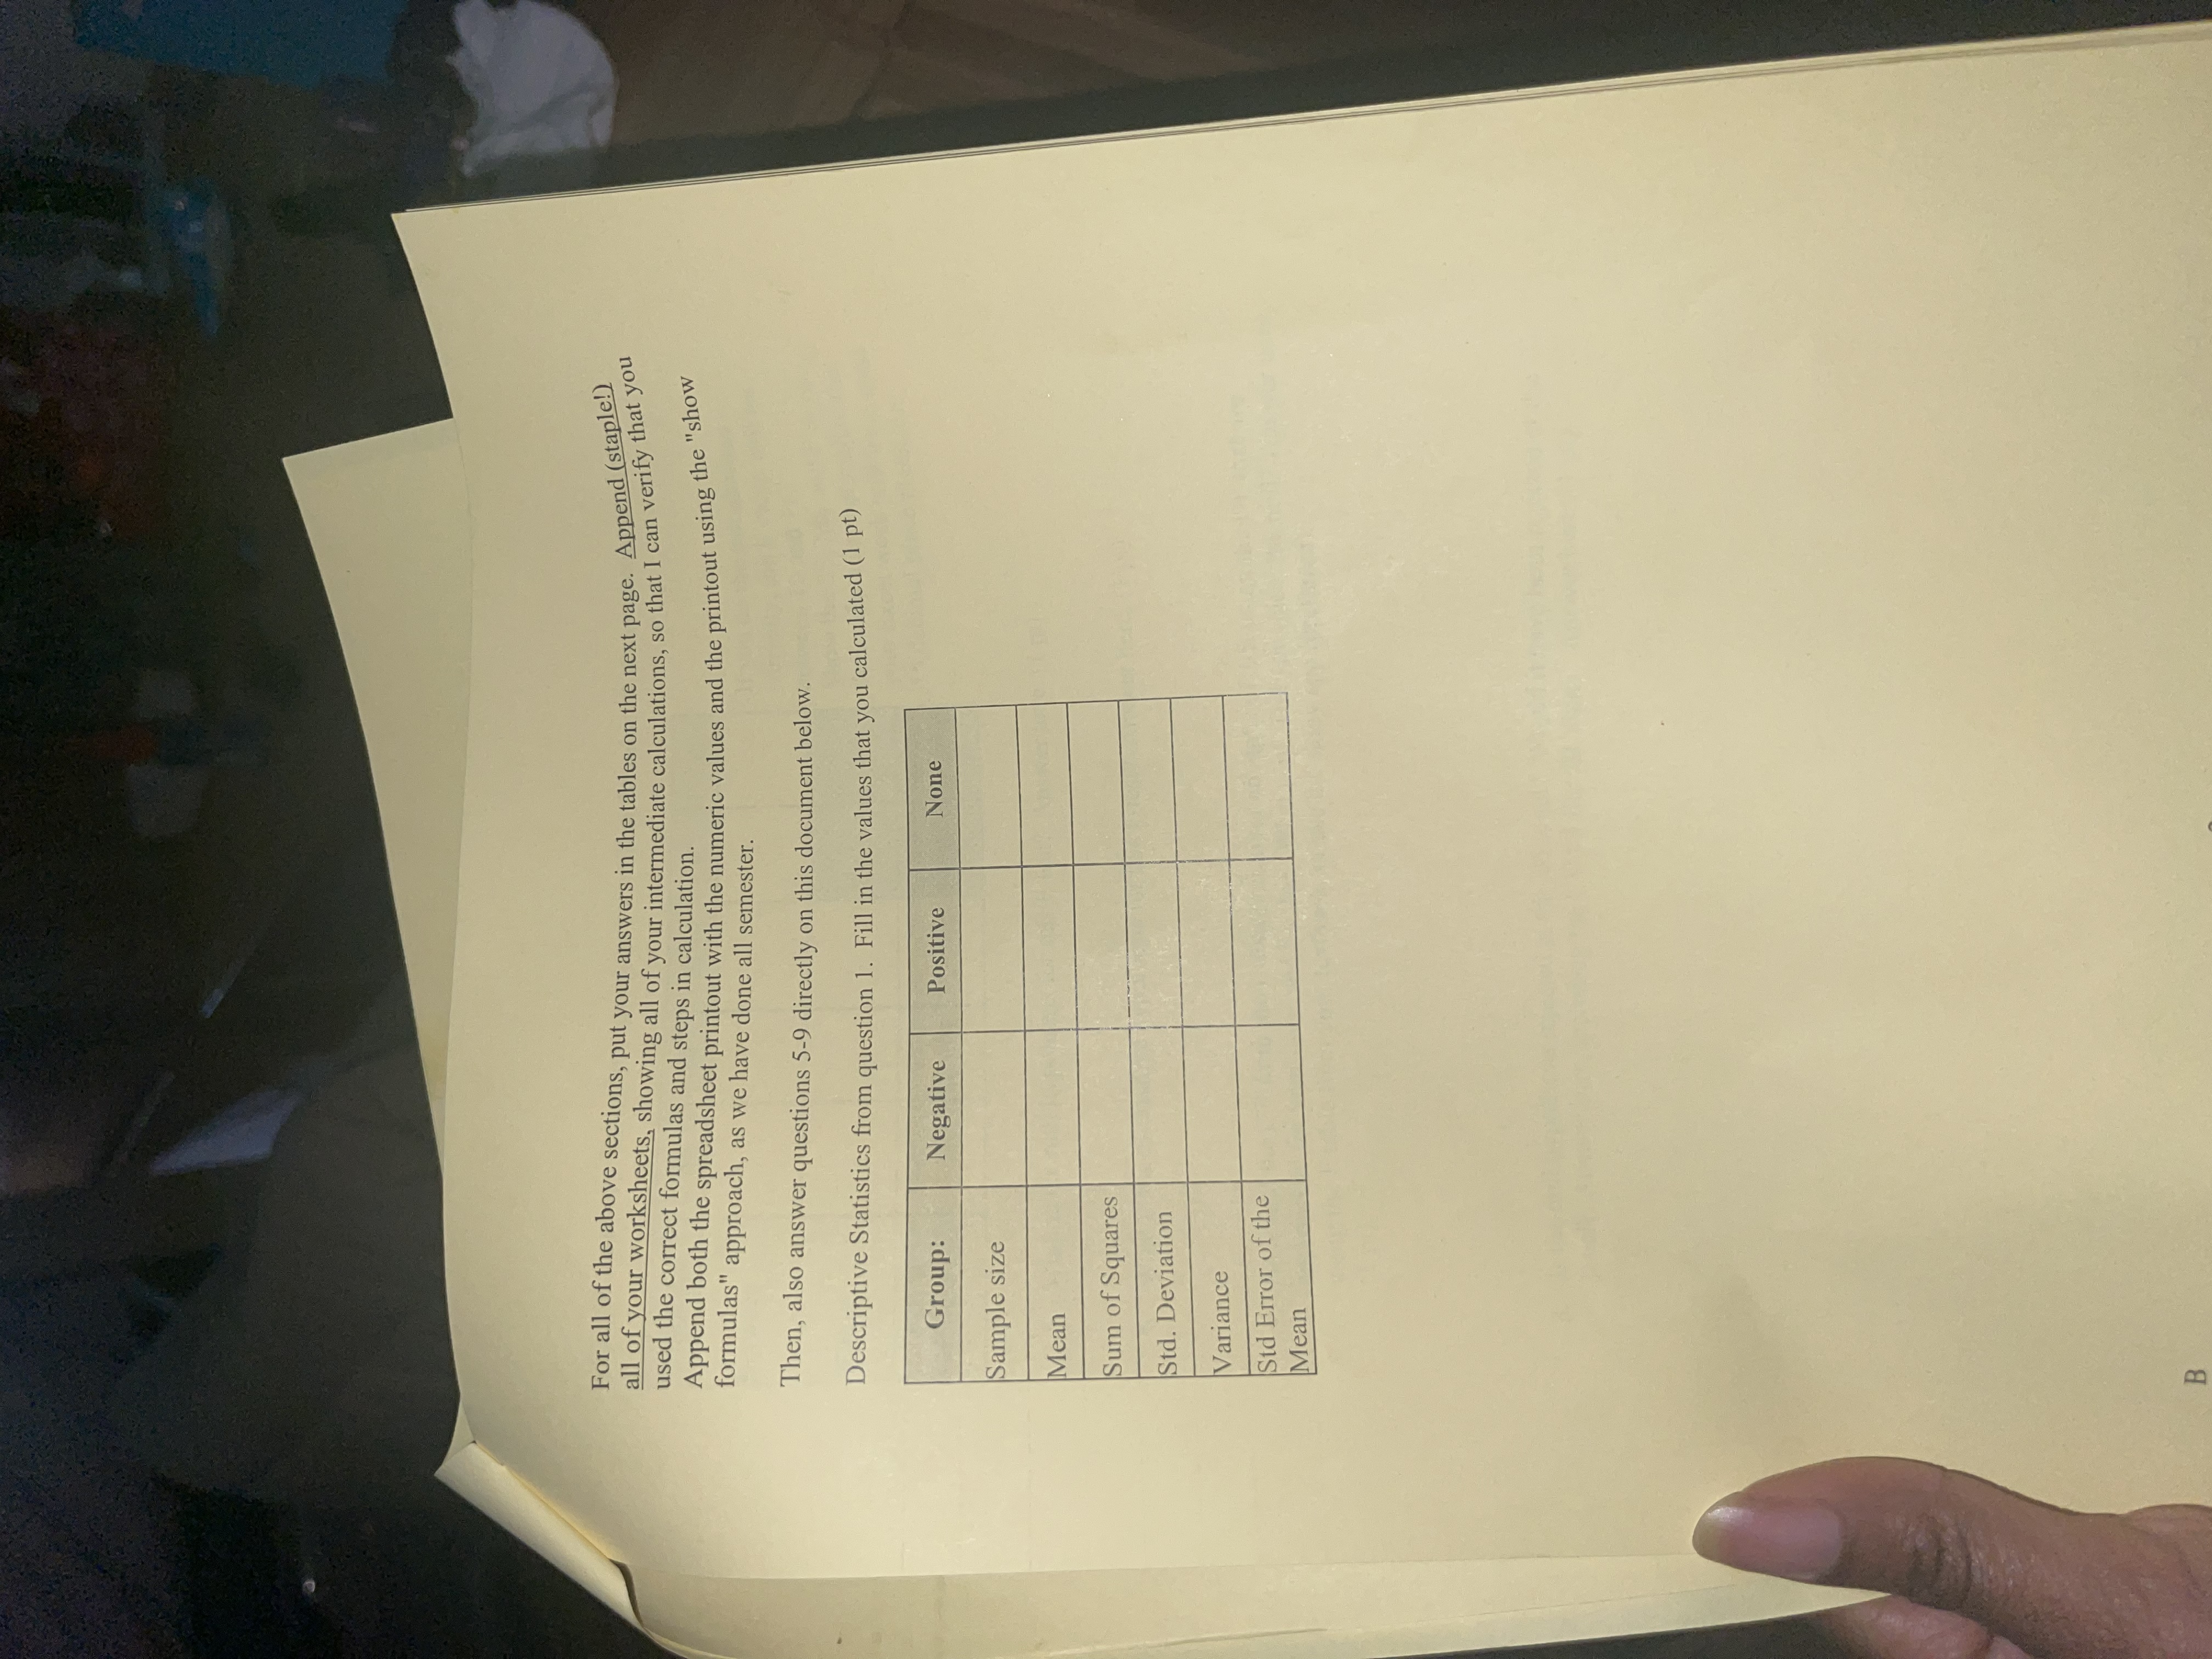
ANOVA Summary Table from questions 2-4. Fill in the values that you calculated. (5 pts) Source SS df MS F P value Between If you do the calculations correctly, the F value will be between 10 and 11. Within Show the SS, MS and F to two decimal places, but realize that your Excel work will have used Total 16 decimal place precision. 5. What is the null hypothesis for this F-test? Answer here. (1 pt) 6. What is the alternative hypothesis for this F-test? Answer here. (1 pt) 7. Now find the CV from the F distribution for an alpha of .05, using the DF that are appropriate for your observed F value. What is it? Did you reject the null? Answer here, using the F table from your textbook, or use the shiny app (preferred). (1 pt) 8. Is the null hypothesis rejected at the .05 level? Would it have been rejected at the .01 level? Answer here, including the CV for the .01 alpha. Answer here .(1 pt) BWhat to turn in for this Part 3? . Create a separate word doc where you copy/paste all of the tables for this analysis it PART 3. produced by JASP. Attach a printout of that document to this document clearly labeling Answers to the following questions here, on this document: (4 pts for performing the JASP analysis, 10 pts for the questions below) What are the df for the BG effects ? Main effect of A Main effect of B Interaction WG (.5 pts each) Is the F for the interaction significant? Describe how you decided. (2 pts) If you decided the interaction was significant, describe why you think it was. That is, describe the patterns of differences in means that you see on the graph in the way we learned to describe interactions in the Nov 10 and 15 classes. Briefly write your answer here. (2 pts) Examine the results of the simple main effect tests. Which of the three are significant? How do these evaluate comparisons you visualized on the graph of the data? And how do they help explain whether there is an interaction? Succinctly write your answers here. (2 pts)c) Does the outcome that you saw with the Tukey test fit what you have as a visual impression from the plot that you asked JASP to draw? Why or Why not? Part III. Two Way ANOVA Analysis and interpretation. (14 pts) 2 way .csv First, find two files on Blackboard, associated with this exam and download them for use: Part3_data_description.pdf Read the data description document. Notice that the three levels of Factor B have the same labels as the three from Part I (but only coincidentally). Examine the graph of the means that is also included in that document, beginning to think about whether you can "see" main effects and/or an interaction. Next, examine the .csv file and see that it is constructed like the three examples we worked in class - two columns for IVs and one column for the DV (errors). Your task is to analyze this 2way design in JASP and answer some questions about interpretation. Perform the overall Analysis in JASP. Include the basic analysis (F test), effect size (eta squared), test of homogeneity of variance, o Tukey test that compares all six cells (the menu permits using the interaction term on which the Tukey tests are performed. With six means, there are 15 pairs to compare. Also ask for evaluation of the simple main effect of Age at levels of Factor B O (reinforcement condition). This should produce three tests (1 df each) that compare adults vs children in each of the three treatment conditions and permit tests of comparing grey vs black bars in the graph you examined.9. Now compute the ratio, SSBG/SSTotal. This ratio is called an eta squared also calls it r. What information value does it have for assisting us to describe the results of this study? Answer here. (1 pt) squared . Your textbook If you do the data analysis for this Part I correctly, the F value will be between 9 and 11. Part II. JASP ANALYSIS OF 1-Way ANOVA (14 pts) components. In general, you will perform the overall analysis that you did in Part I, with the same data, and add a few Begin by creating a correctly formatted (like the ones used for class examples used for export to csv and use in JASP). Make different Excel spreadsheet with the data from Part I, leaving out the additional calculations that you did for the structural model in part I - this one should just have the data. Look carefully at the three examples of I way ANOVA that we did in class so that you can see how these spreadsheets and .csy files are structured. The IV should be called mood and the DV should be called checking. Call the three levels of mood Positive, Negative, and Control when you enter the data. Save this file and then export it to a .csy file Import the data set (the .csv file) to JASP Use the classical ANOVA procedure to perform the analysis. Verify that the overall analysis matches what you found in Part I. Troubleshoot if they differ. (If the F values match then you did it correctly. If the F values don't match, then you may have made a data entry error, a setup error in the spreadsheet or JASP, or you may have made a calculation mistake in Part I. Specifically, 1. Perform the overall analysis with mood as the IV and checking as the DV. 2. Request descriptive statistics and the eta squared statistic. 3. Request the homogeneity of variance test. 4. Request Tukey tests to compare all three pairs of group means. 5. Request the raincloud plot. Make sure you understand what the three components of the raincloud plot are - this may be an in class exam question. B 5What to turn in for this portion? your data set. 1. Copy/paste the data from Excel into your MS Word doc so that I can see the structure of 2. Do a screen capture, or copy/paste all of the tables/figures that you produced in JASP into aMS Word doc and print those components out, to be attached and turned in with this document. Attach that printout to this document, clearly labeling that it is Part II. For both 1 and 2, copy/paste your figures/tables as figures/images so that you can resize and arrange them in your Word doc to save paper. (9 pts for correctly doing the analysis and having the F test match your structural model analysis) If you do the data analysis correctly, the F value will be between 9 and 11. Answer these additional questions about the analysis here (2 pts each): a) Is the homogeneity of variance assumption evaluated in the JASP analysis you did? What did you conclude? How would that impact your interpretation of the F test that you originally did in Excel and the repeated with JASP? b) Which of the three treatment groups was significantly different from each other when tested by the Tukey test (summarize the three different tests). Why is the Tukey test preferred to using three different two-sample t-tests (independent samples t-test)? BPart I. Oneway ANOVA computation (11 pts) Consider the following data set based on a study by Davey, et al (2003) and outlined by Howell. The study investigated the role of mood on the degree of compulsive checking in which a person engaged (compulsive checking is involved in a number of psychopathologies). each listened to music designed to produce a positive, negative or new "list as many things around your home that you should check for safety or security ps of seven participants negative or neutral mood . They were then asked to away" for three weeks. The dependent variable was the number of things listed. These are the data from or security reasons before you go the 21 total subjects; the three different treatment groups are in the three columns (7 subjects in each). negative positive control 10 11 8 12 6 14 7 11 20 3 9 22 10 11 11 5 5 16 Your task, generally, is to perform an ANOVA on these data. Use Excel to do the computations and use the structural model approach exemplified with the Excel sheets for the class examples and formula handout reviewed in class. You can also refer to answers for the bonus part of HW6. Specifically, you are to: 1. Compute the mean, SS, variance std deviation, and std error of the mean for each of the three groups. (you learned how to do these calculations with Excel earlier in the semester. You will use these values in other calculations, so they need to be correct. Make sure the use the s' version of the variance formula (with the n-] denominator). If you do any computations by hand (calculator) make sure to carry your computations to at least three decimal places. 2. Perform the ANOVA using methods outlined in class lecture powerpoint document and the spreadsheet provided for the in-class analysis of the Rows/TestScores illustration or the CFF illustration. Calculate the SSBG, SSWG, and SSTotal. Make sure that the two partitioned SS add up to the total. Note that the SSwo can be obtained by a method that uses the three SS you calculated above in question #1. Make sure you do this using the "structural model" approach that the classroom spreadsheet illustration used. BUILD YOUR SPREADSHEET FROM SCRATCH. DO NOT START WITH THE ONES MADE AVAILABLE FOR CLASS WORK. 3. Once you have the SS, identify the df for each term. Now calculate MSBG, MSwo, and MSTotal. 4. Compute the observed F ratio for this data set (carry to two decimal places). Find the p value for the test of this observed F and decide whether to reject the null hypothesis B 2For all of the above sections, put your answers in the tables on the next page. Append (staple!) all of your worksheets, showing all of your intermediate calculations, so that I can verify that you used the correct formulas and steps in calculation. Append both the spreadsheet printout with the numeric values and the printout using the "show formulas" approach, as we have done all semester. Then, also answer questions 5-9 directly on this document below. Descriptive Statistics from question 1. Fill in the values that you calculated (1 pt) Group: Negative Positive None Sample size Mean Sum of Squares Std. Deviation Variance Std Error of the Mean
Step by Step Solution
There are 3 Steps involved in it

Get step-by-step solutions from verified subject matter experts