

Question: Follow the 6 steps in Hypothesis Testing. Set up the hypotheses and check conditions. Decide on the significance level Calculate the test statistic Calculate probability
Follow the 6 steps in Hypothesis Testing.
- Set up the hypotheses and check conditions.
- Decide on the significance level
- Calculate the test statistic
- Calculate probability value (p-value), or find the rejection region
- Make a decision about the null hypothesis
- State an overall conclusion.
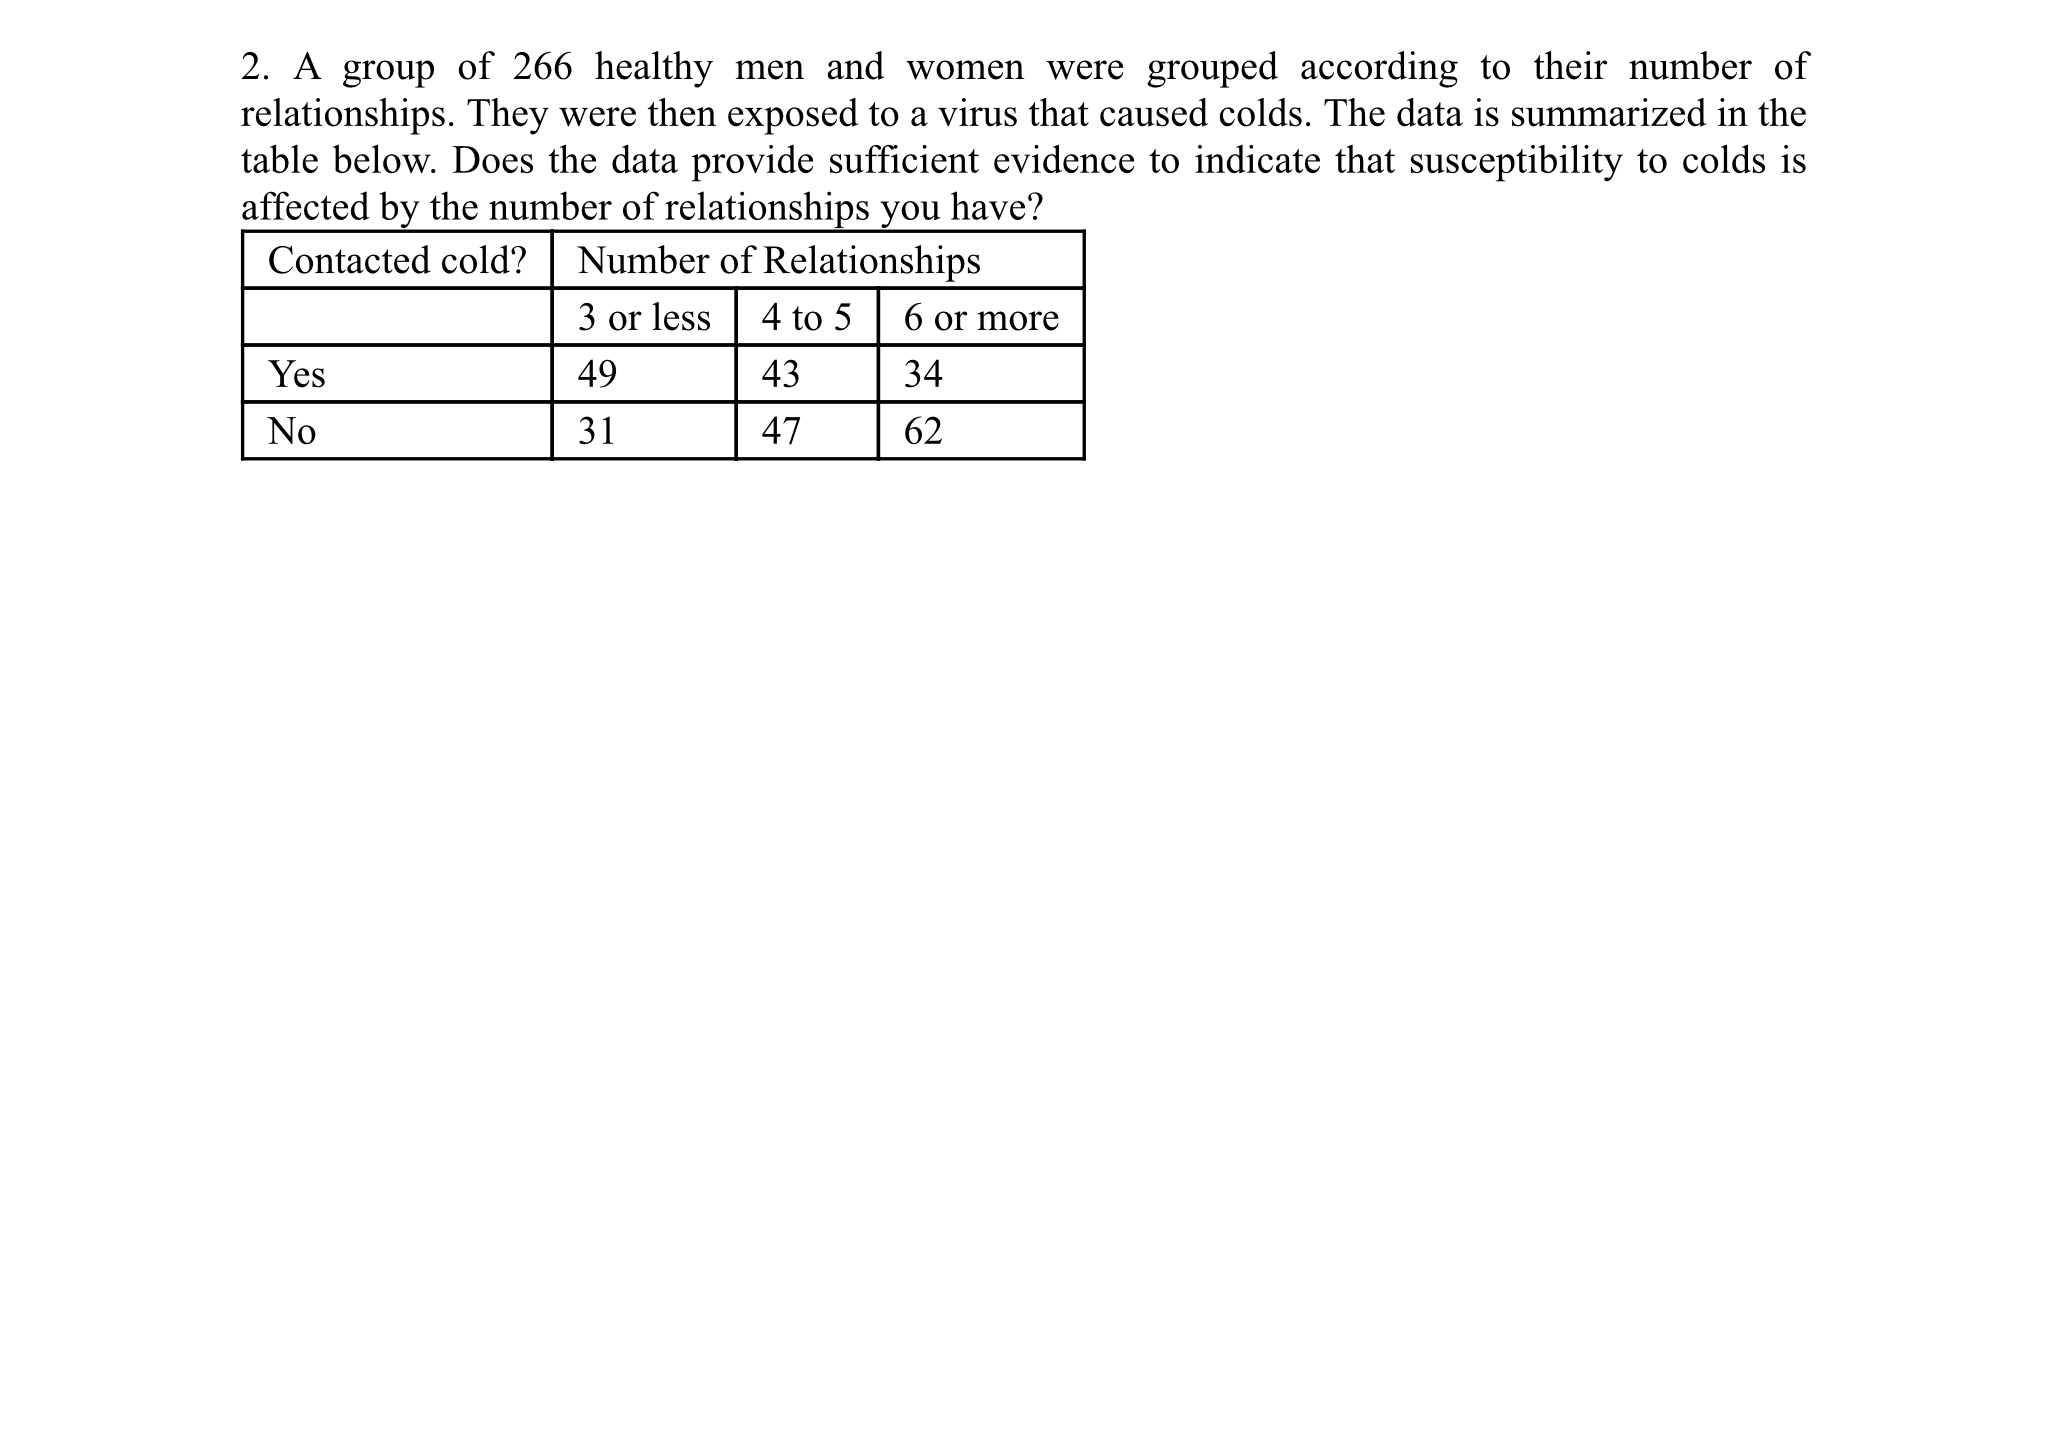
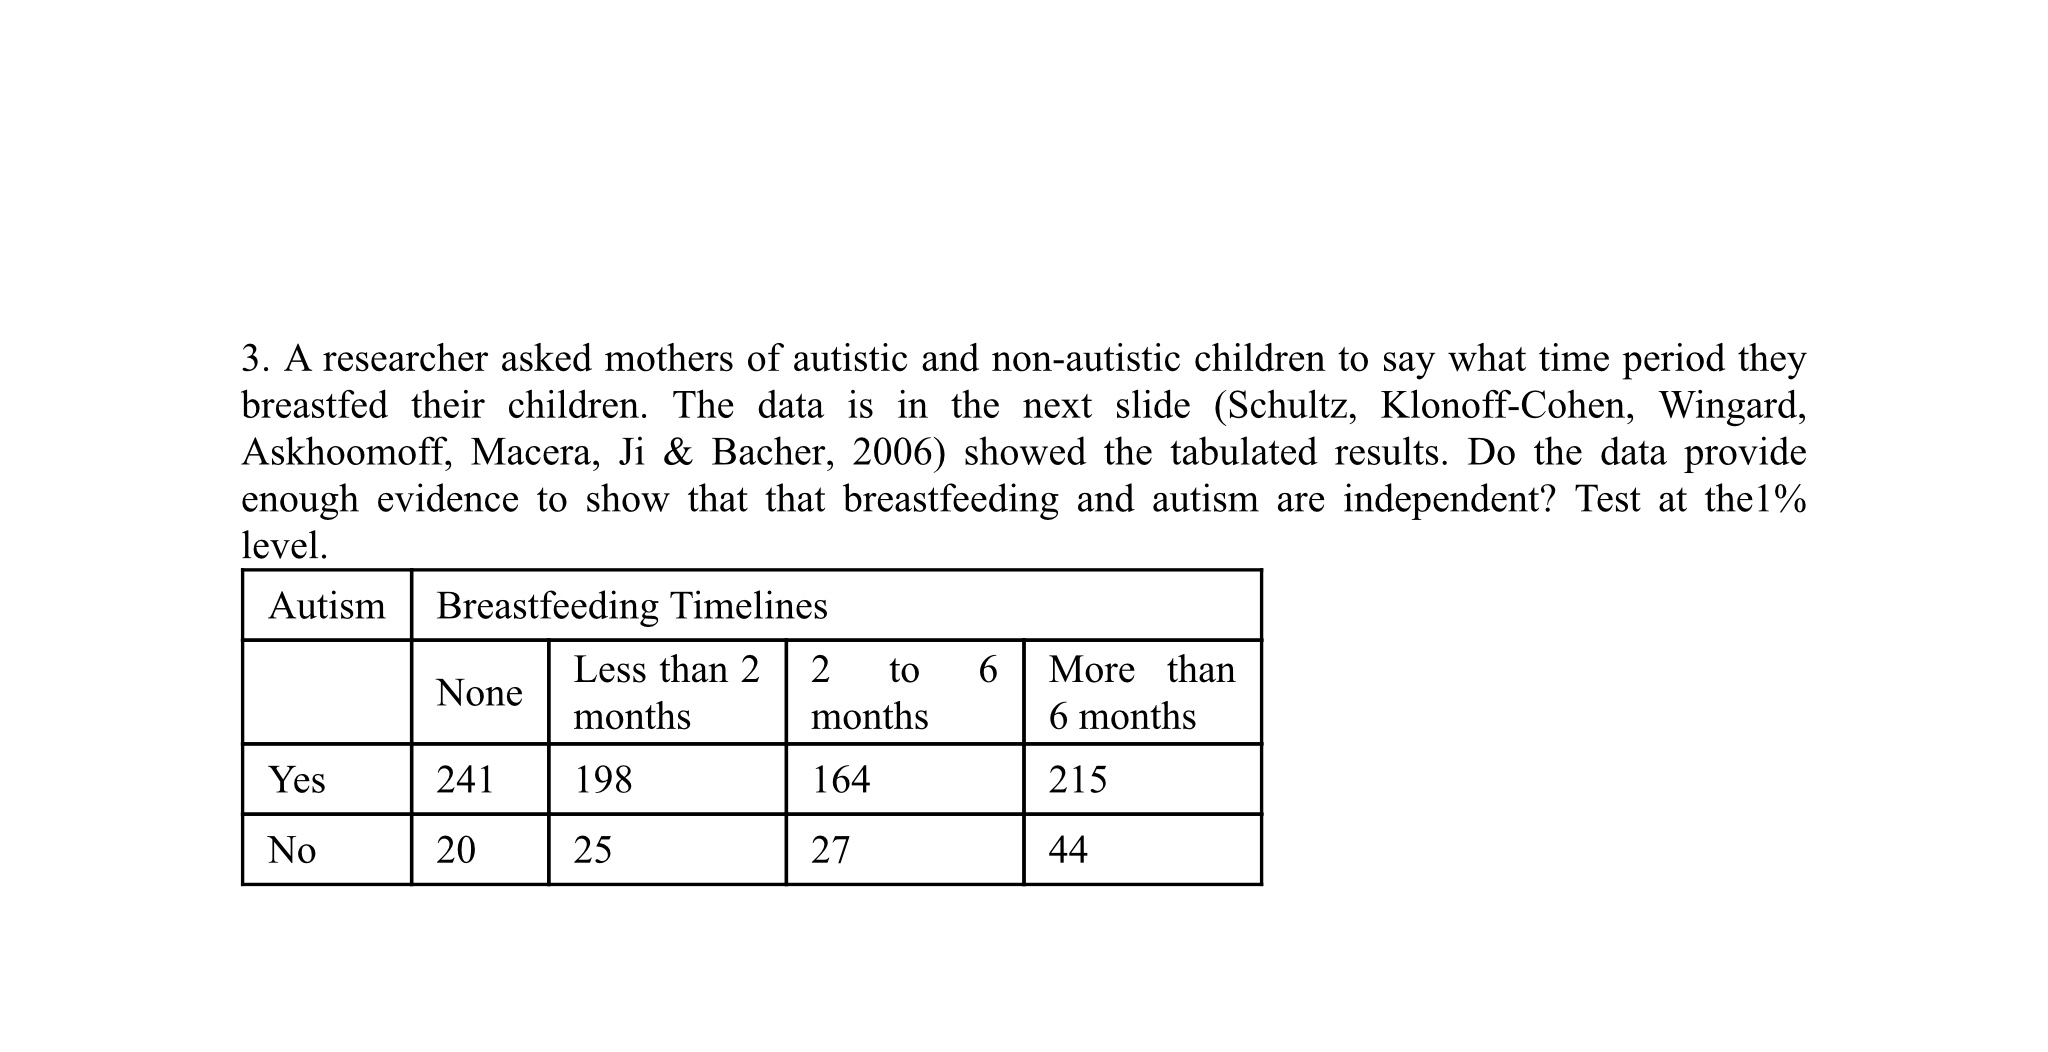
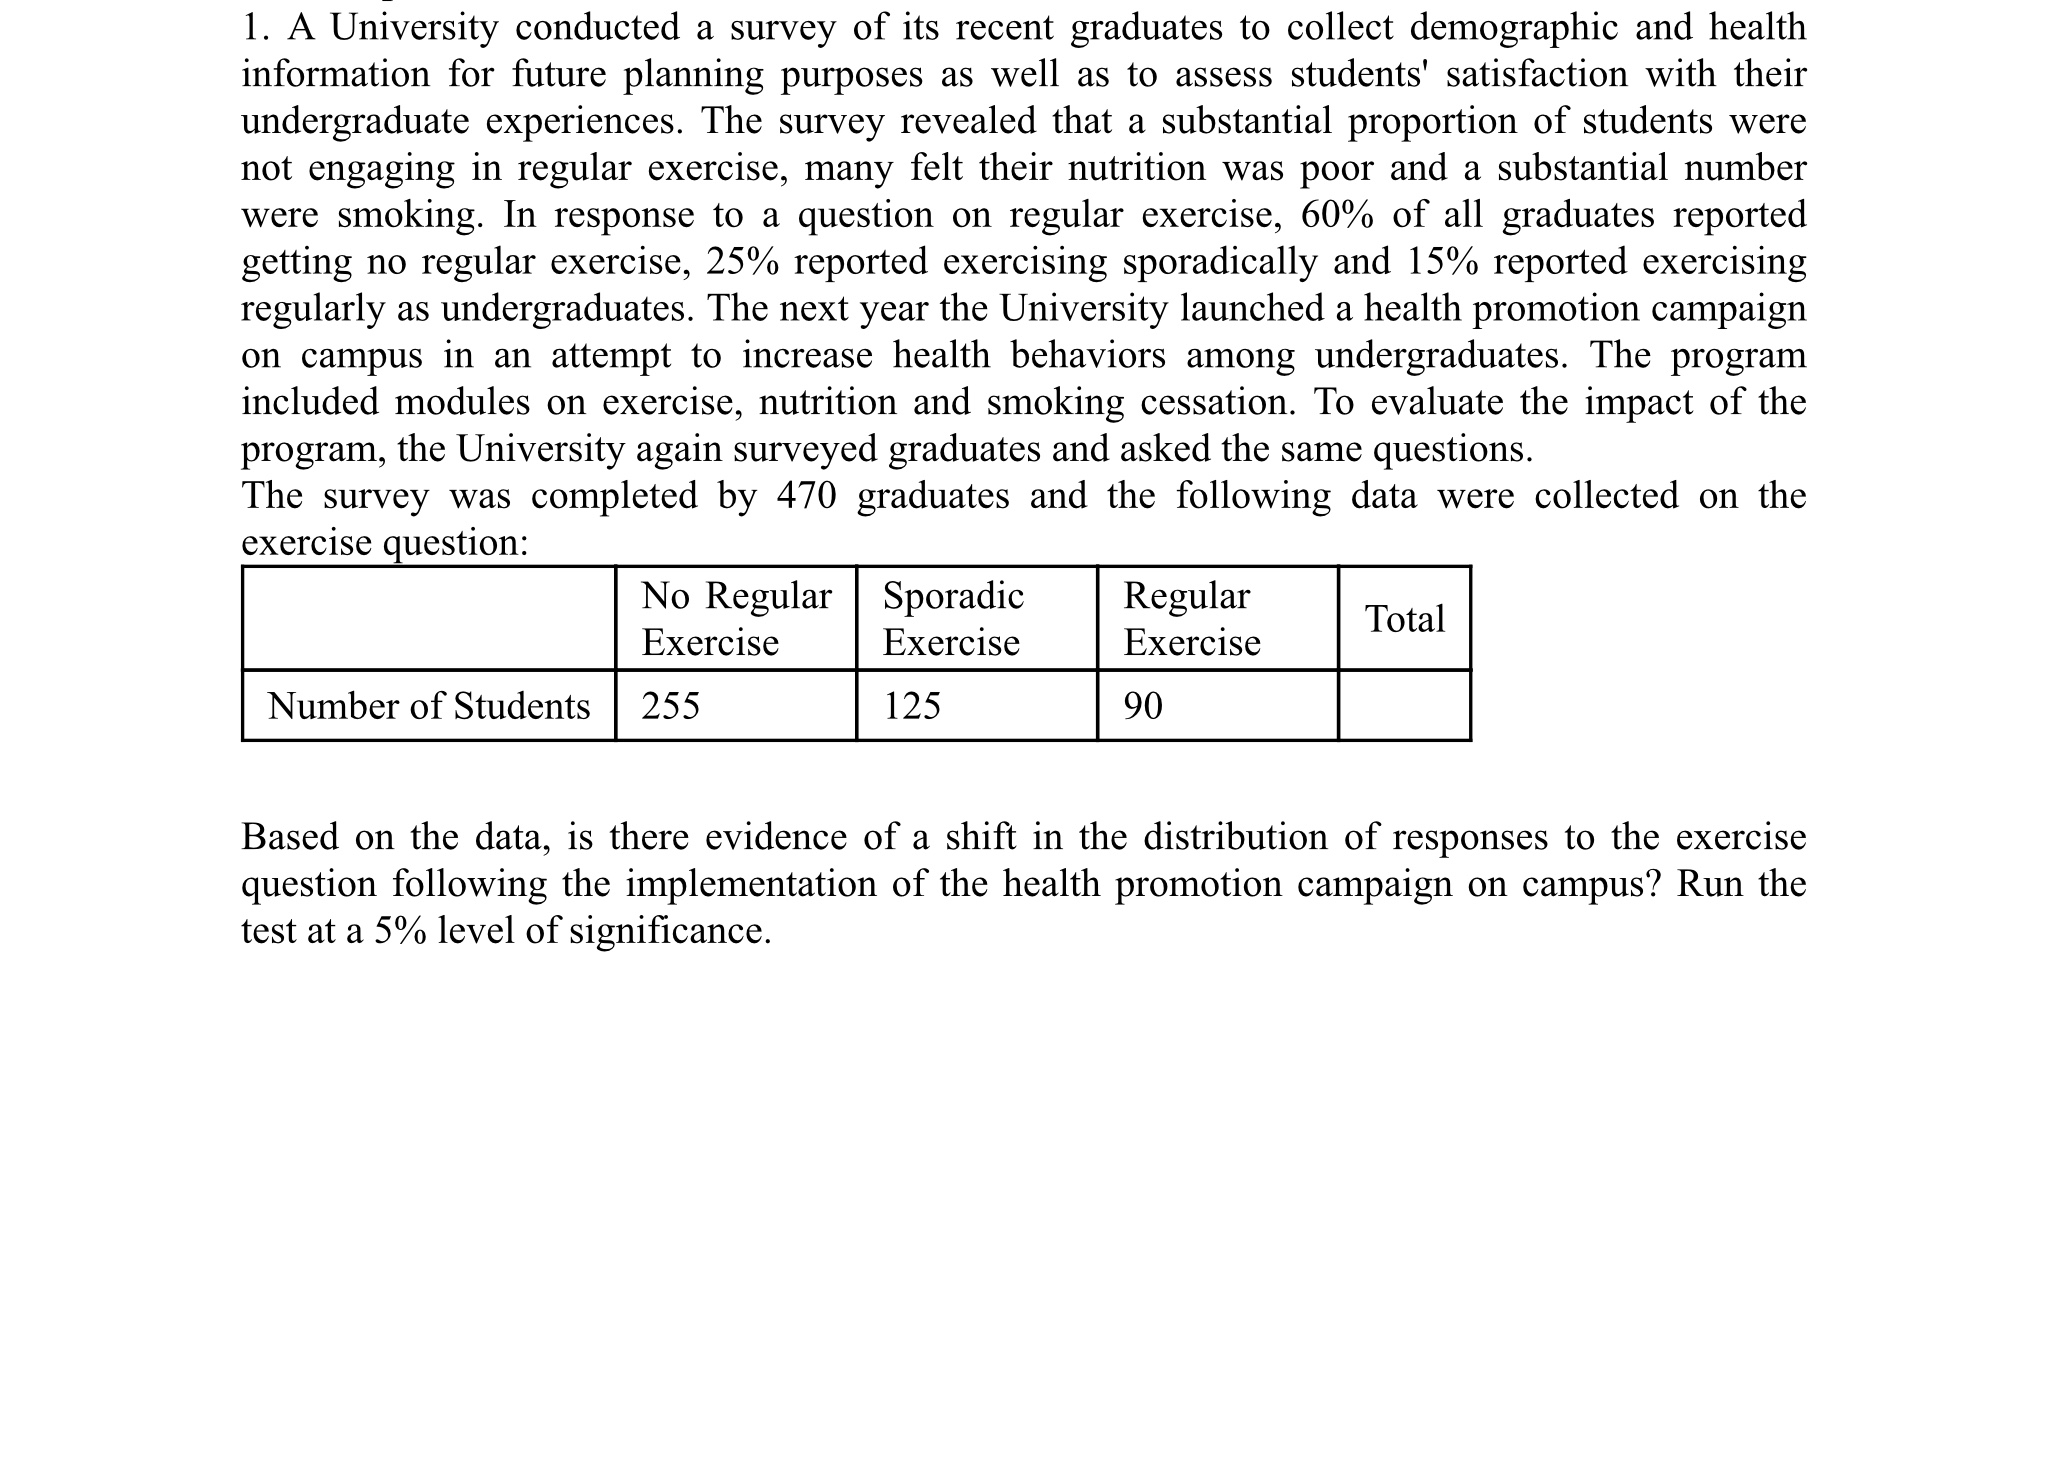
2. A group of 266 healthy men and women were grouped according to their number of relationships. They were then exposed to a virus that caused colds. The data is summarized in the table below. Does the data provide sufficient evidence to indicate that susceptibility to colds is affected by the number of relationships you have? Contacted cold? Number of Relationships 3 or less 4 to 5 6 or more Yes 49 43 34 No 31 47 623. A researcher asked mothers of autistic and non-autistic children to say what time period they breastfed their children. The data is in the next slide (Schultz, Klonoff-Cohen, Wingard, Askhoomoff, Macera, Ji & Bacher, 2006) showed the tabulated results. Do the data provide enough evidence to show that that breastfeeding and autism are independent? Test at the 1% level. Autism Breastfeeding Timelines Less than 2 2 to 6 More than None months months 6 months Yes 241 198 164 215 No 20 25 27 441. A University conducted a survey of its recent graduates to collect demographic and health information for future planning purposes as well as to assess students' satisfaction with their undergraduate experiences. The survey revealed that a substantial proportion of students were not engaging in regular exercise, many felt their nutrition was poor and a substantial number were smoking. In response to a question on regular exercise, 60% of all graduates reported getting no regular exercise, 25% reported exercising sporadically and 15% reported exercising regularly as undergraduates. The next year the University launched a health promotion campaign on campus in an attempt to increase health behaviors among undergraduates. The program included modules on exercise, nutrition and smoking cessation. To evaluate the impact of the program, the University again surveyed graduates and asked the same questions. The survey was completed by 470 graduates and the following data were collected on the exercise uestion: No Regular Sporadic Regular Total Exercise Exercise Exercise Based on the data, is there evidence of a shift in the distribution of responses to the exercise question following the implementation of the health promotion campaign on campus? Run the test at a 5% level of signicance
Step by Step Solution
There are 3 Steps involved in it

Get step-by-step solutions from verified subject matter experts