

Question: Follow the Bouncing Ball This scatter plot shows the relationship between the rebound height of a ball and the height from which the ball is
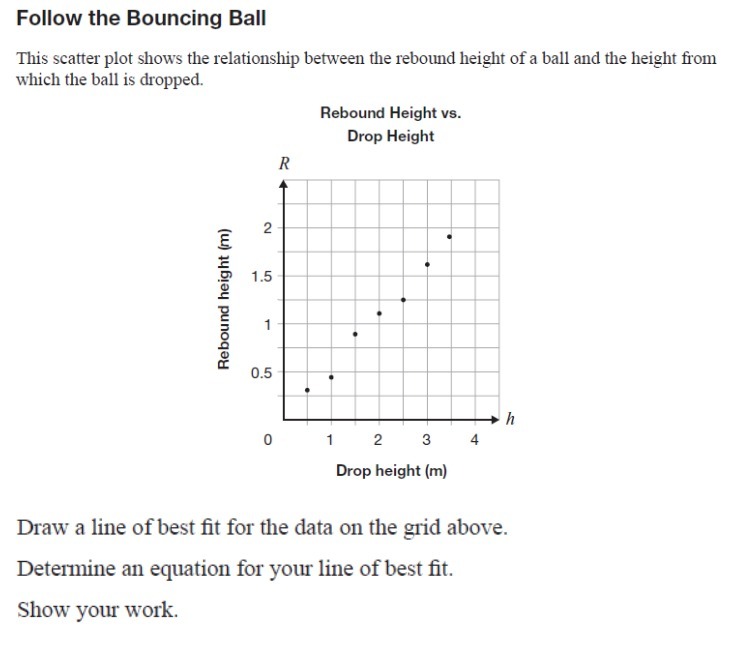
Follow the Bouncing Ball This scatter plot shows the relationship between the rebound height of a ball and the height from which the ball is dropped. Rebound Height vs. Drop Height R 2 1.5 Rebound height (m) 0.5 h 0 1 2 3 4 Drop height (m) Draw a line of best fit for the data on the grid above. Determine an equation for your line of best fit. Show your work
Step by Step Solution
There are 3 Steps involved in it
1 Expert Approved Answer
Step: 1 Unlock

Question Has Been Solved by an Expert!
Get step-by-step solutions from verified subject matter experts
Step: 2 Unlock
Step: 3 Unlock