

Question: Follow the data reference and answer the below question, please. Q1: Which market has the highest and lowest market attractiveness in 2020? Q2: Which market
Follow the data reference and answer the below question, please.
Q1: Which market has the highest and lowest market attractiveness in 2020?
Q2: Which market has the highest and lowest market attractiveness in 2025?
Q3: In which market is the business strength highest and lowest in the year 2020?
Q4: In which market is the business strength highest and lowest in the year 2025?
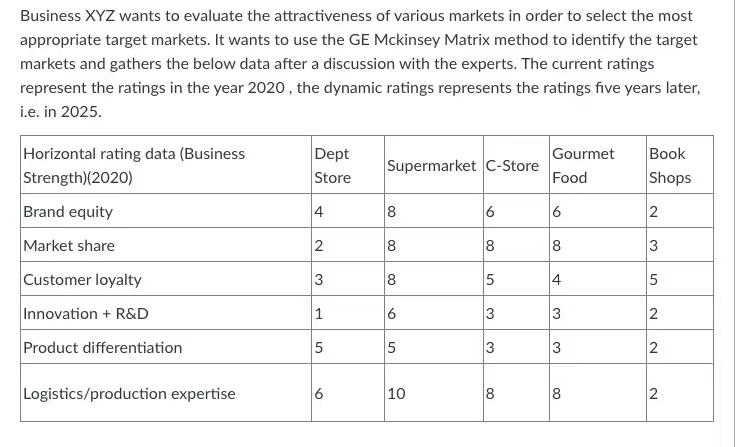
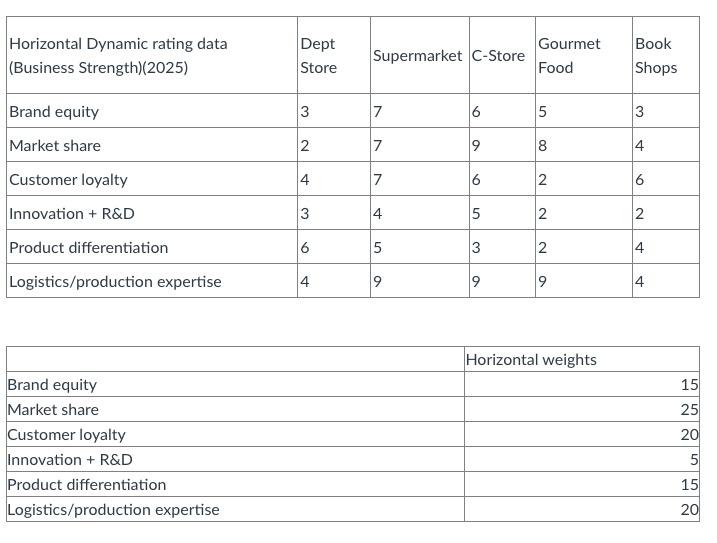
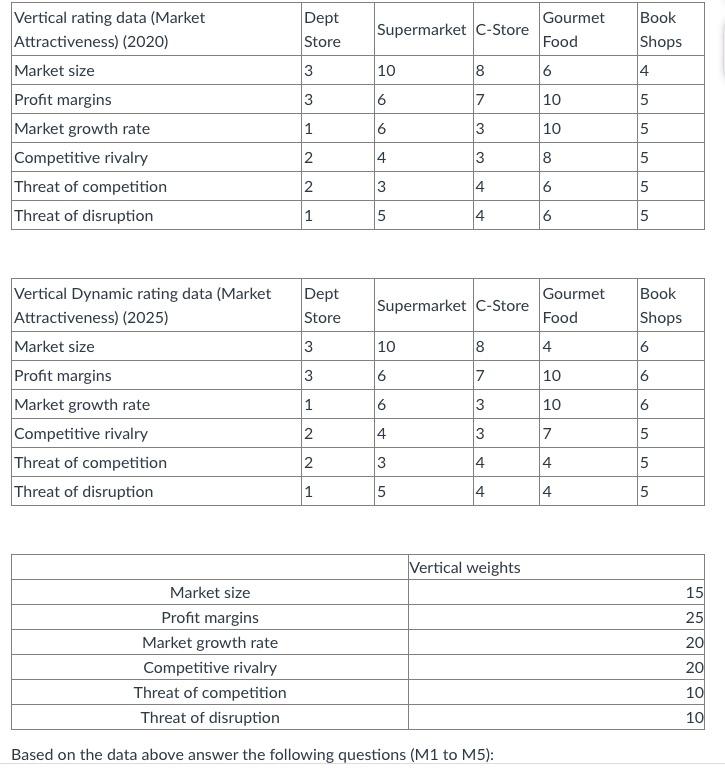
Business XYZ wants to evaluate the attractiveness of various markets in order to select the most appropriate target markets. It wants to use the GE Mckinsey Matrix method to identify the target markets and gathers the below data after a discussion with the experts. The current ratings represent the ratings in the year 2020, the dynamic ratings represents the ratings five years later, i.e. in 2025. Dept Store Supermarket C-Store Gourmet Food Book Shops 4 8 6 6 2 Horizontal rating data (Business Strength)(2020) Brand equity Market share Customer loyalty Innovation + R&D Product differentiation N 8 8 8 00 8 3 00 8 5 4 5 1 6 3 3 2 5 5 3 3 2. Logistics/production expertise 6 10 8 00 8 2 Horizontal Dynamic rating data (Business Strength)(2025) Dept Store Gourmet Supermarket C-Store Food Book Shops 3 7 6 5 3 Brand equity Market share N 7 9 9 8 4 Customer loyalty 4 7 6 N 6 3 4 5 N 2 N 2 Innovation + R&D Product differentiation 6 5 3 2 4 Logistics/production expertise 4 9 9 9 4 Horizontal weights 15 25 20 Brand equity Market share Customer loyalty Innovation + R&D Product differentiation Logistics/production expertise 5 15 20 Dept Store Supermarket C-Store Gourmet Food Book Shops 3 10 8 8 6 4 3 6 7 10 5 Vertical rating data (Market Attractiveness) (2020) Market size Profit margins Market growth rate Competitive rivalry Threat of competition Threat of disruption 1 6 3 10 5 N 4 3 8 00 5 N 3 4 6 5 1 5 5 4 6 5 Dept Store Supermarket C-Store Gourmet Food Book Shops 3 10 8 4 6 3 6 7 10 6 Vertical Dynamic rating data (Market Attractiveness) (2025) Market size Profit margins Market growth rate Competitive rivalry Threat of competition Threat of disruption 1 6 3 10 5 6 N 4 3 7 5 2. 3 4 st 4 5 1 5 5 4 4 5 1 15 25 20 Vertical weights Market size Profit margins Market growth rate Competitive rivalry Threat of competition Threat of disruption Based on the data above answer the following questions (M1 to M5): 20 10 100
Step by Step Solution
There are 3 Steps involved in it
1 Expert Approved Answer
Step: 1 Unlock

Question Has Been Solved by an Expert!
Get step-by-step solutions from verified subject matter experts
Step: 2 Unlock
Step: 3 Unlock