

Question: Follow the instructions and show your solution Directions: Solve the following problems using your t distribution table. Indicate the graphical presentation of each problem. 1.

Follow the instructions and show your solution
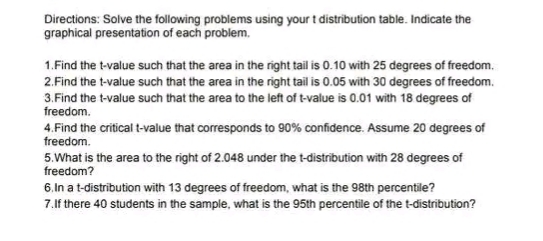
Directions: Solve the following problems using your t distribution table. Indicate the graphical presentation of each problem. 1. Find the t-value such that the area in the right tail is 0.10 with 25 degrees of freedom. 2. Find the t-value such that the area in the right tail is 0.05 with 30 degrees of freedom. 3. Find the t-value such that the area to the left of t-value is 0.01 with 18 degrees of freedom. 4. Find the critical t-value that corresponds to 90% confidence. Assume 20 degrees of freedom. 5.What is the area to the right of 2.048 under the t-distribution with 28 degrees of freedom? 6. In a t-distribution with 13 degrees of freedom, what is the 98th percentile? 7. If there 40 students in the sample, what is the 95th percentile of the t-distribution
Step by Step Solution
There are 3 Steps involved in it

Get step-by-step solutions from verified subject matter experts