

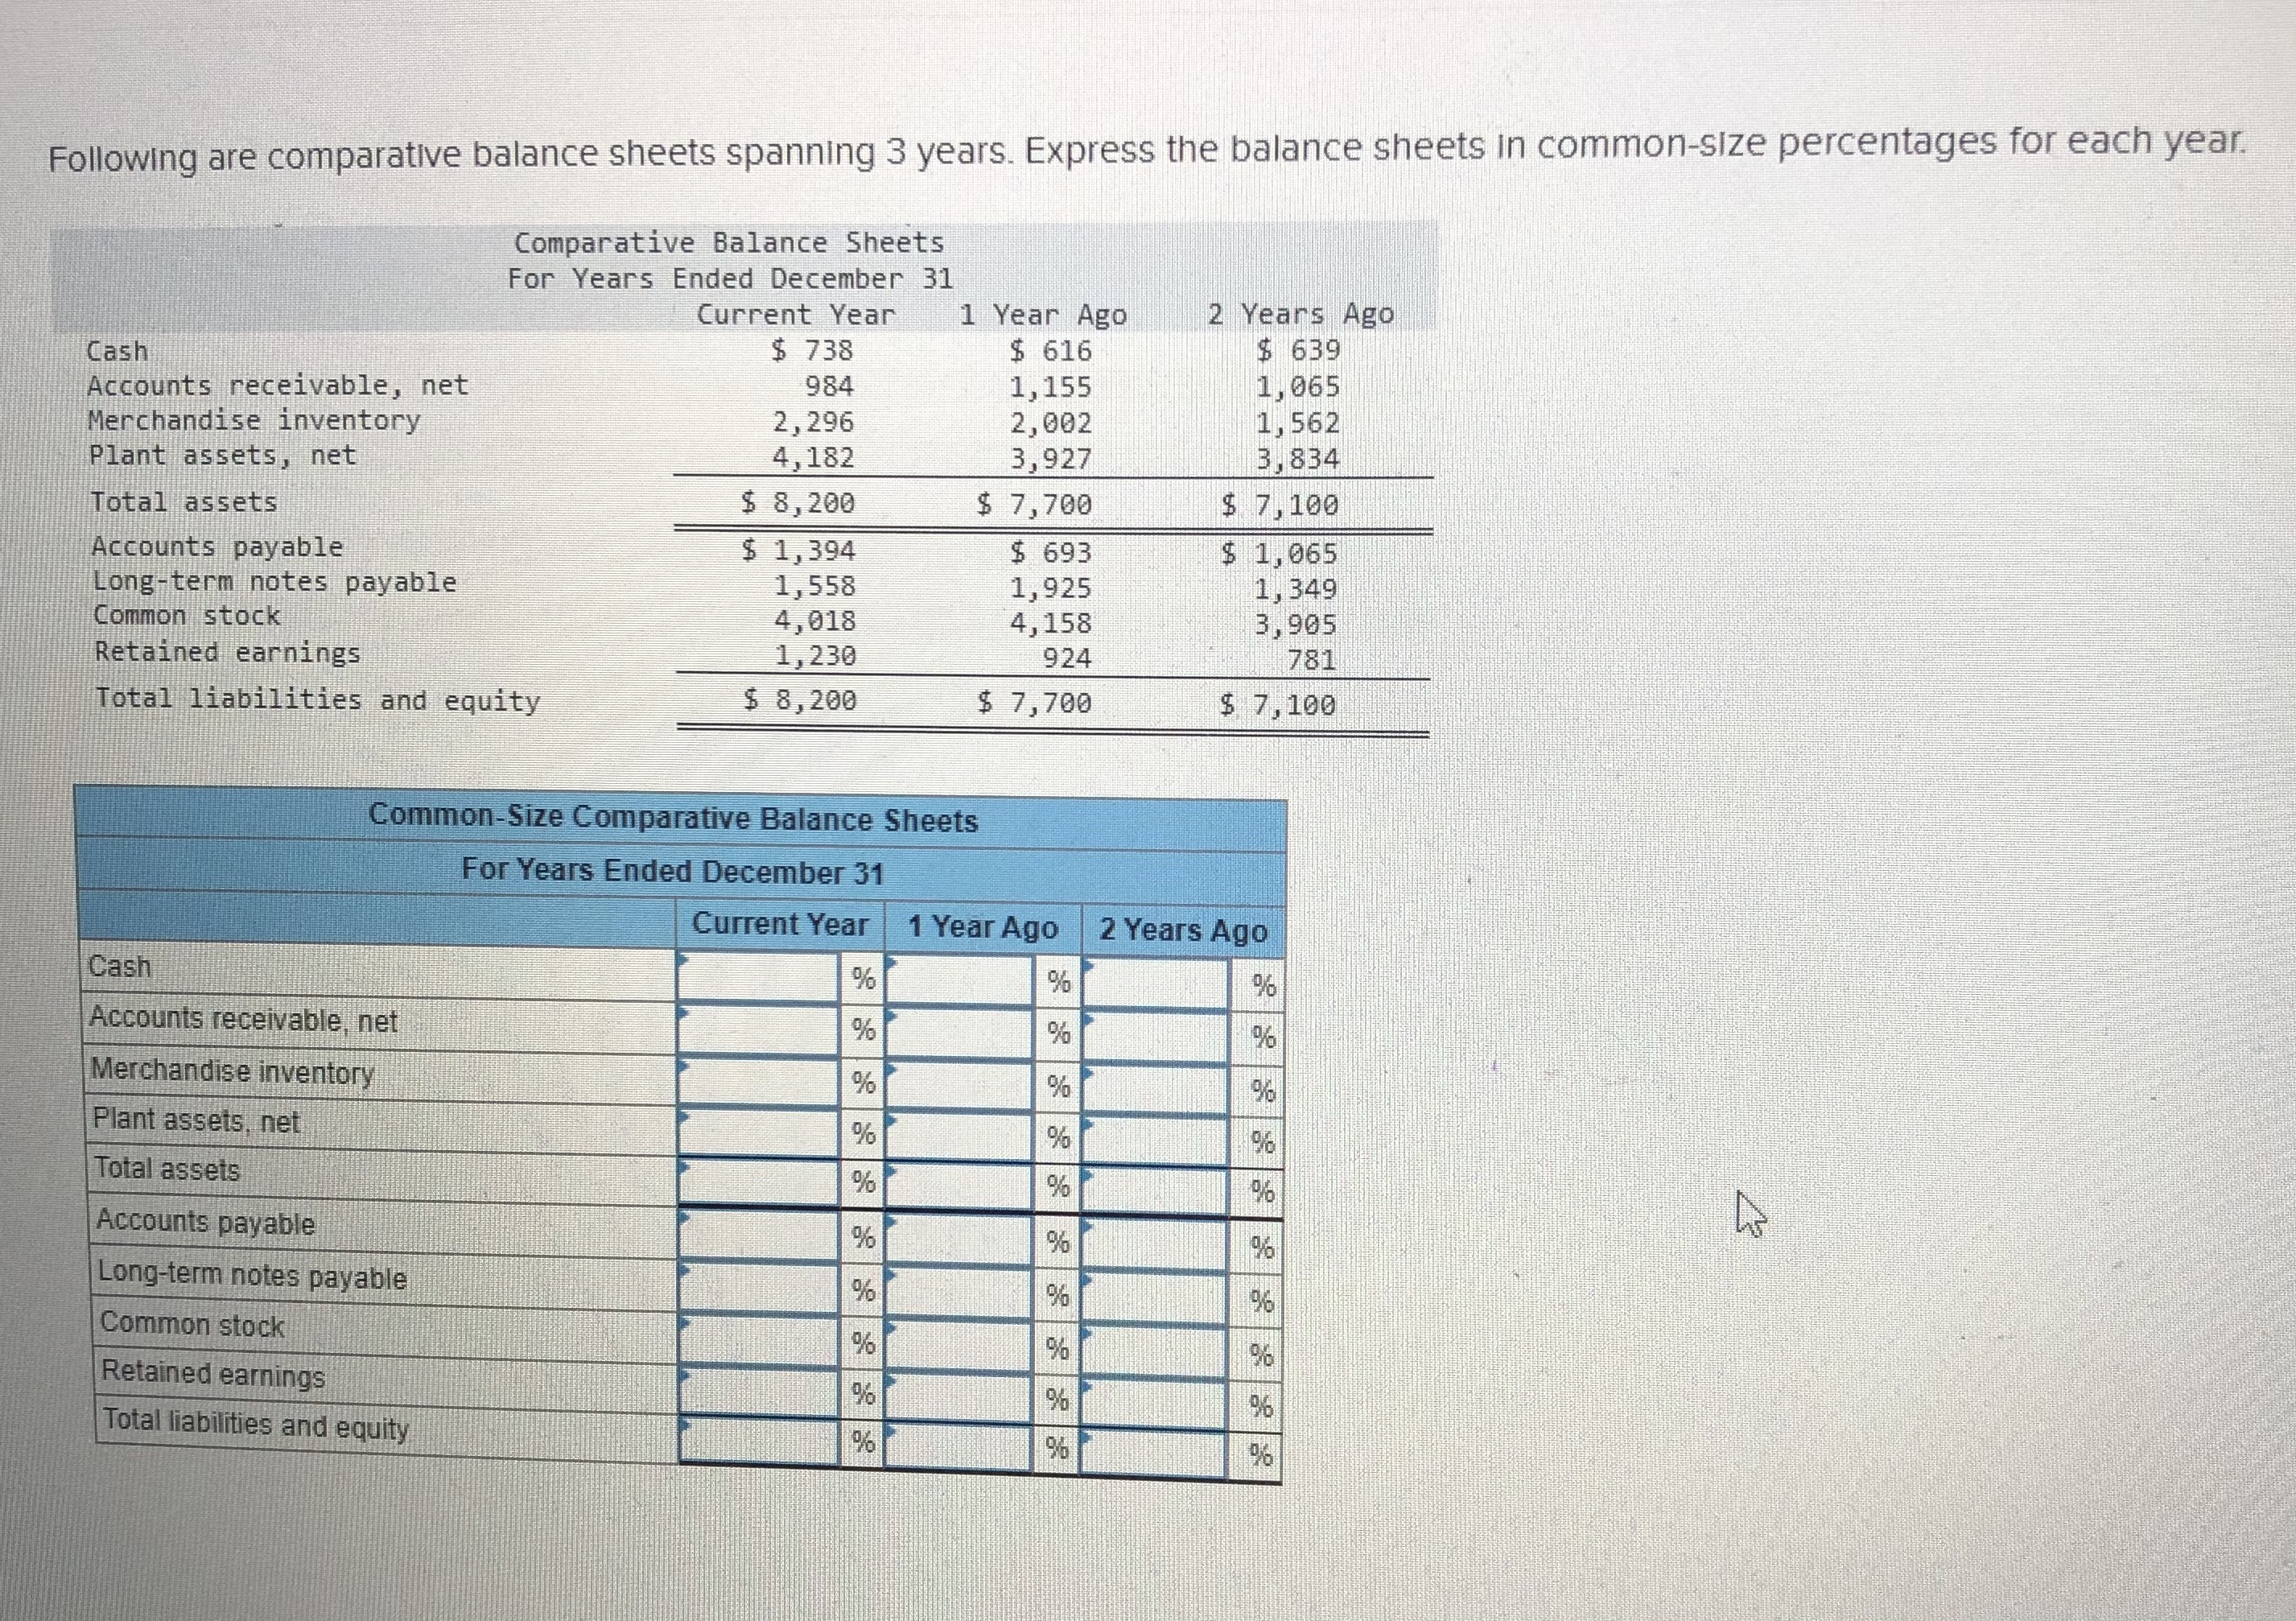
Question: Following are comparative balance sheets spanning 3 years. Express the balance sheets in common - size percentages for each year. table [ [ Comparative
Following are comparative balance sheets spanning years. Express the balance sheets in commonsize percentages for each year.
tableComparative Balance Sheets
For Years Ended December Cash$ $ $ Accounts receivable, net,Merchandise inventory,Plant assets, net,Total assets,$ $ $ Accounts payable,$ $ $ Longterm notes payable,Common stock,Retained earnings,Total liabilities and equity,$ $ $
tableCommonSize Comparative Balance SheetsFor Years Ended December Current Year, Year Ago, Years AgoCashAccounts receivable, net,,Merchandise inventory,,Plant assets, net,,Total assets,,Accounts payable,,Longterm notes payable,,
Step by Step Solution
There are 3 Steps involved in it
1 Expert Approved Answer
Step: 1 Unlock

Question Has Been Solved by an Expert!
Get step-by-step solutions from verified subject matter experts
Step: 2 Unlock
Step: 3 Unlock