

Question: Following are comparative balance sheets spanning 3 years. Express the balance sheets in common-size percentages for each year. Comparative Balance Sheets For Years Ended
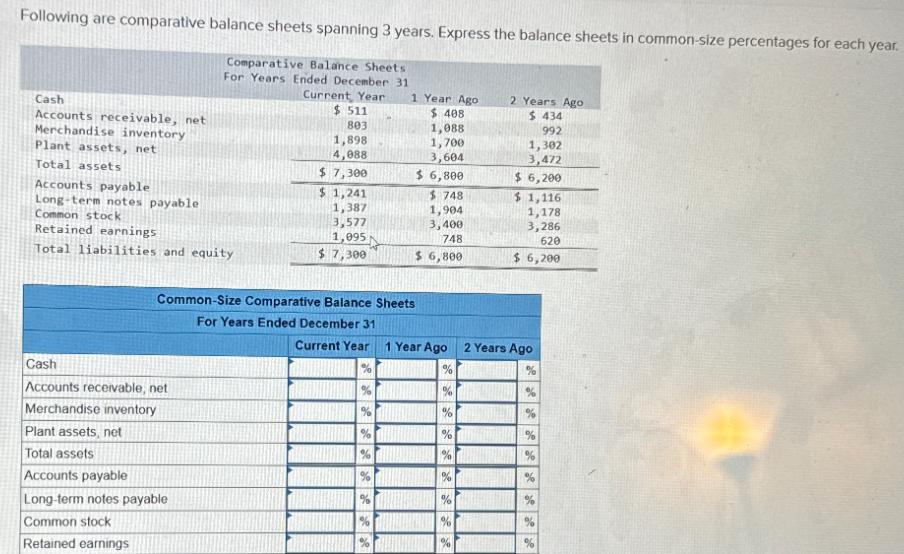
Following are comparative balance sheets spanning 3 years. Express the balance sheets in common-size percentages for each year. Comparative Balance Sheets For Years Ended December 31 Current Year $ 511 Cash Accounts receivable, net Merchandise inventory Plant assets, net Total assets Accounts payable Long-term notes payable Common stock Retained earnings Total liabilities and equity Cash 1 Year Ago 2 Years Ago $ 408 $ 434 803 1,088 992 1,898 1,700 4,088 3,604 $ 7,300 $ 6,800 $ 1,241 1,387 3,577 1,095 748 $ 748 1,904 3,400 1,302 3,472 $ 6,200 $ 1,116 1,178 3,286 620 $ 7,300 $ 6,800 $ 6,200 Common-Size Comparative Balance Sheets For Years Ended December 31 Current Year 1 Year Ago 2 Years Ago % % % Accounts receivable, net Merchandise inventory % Plant assets, net % % % Total assets % Accounts payable % Long-term notes payable % % % Common stock % % Retained earnings %
Step by Step Solution
There are 3 Steps involved in it

Get step-by-step solutions from verified subject matter experts