

Question: Following are cost and schedule data for a project that is underway. Using the cost data in the cost table above, create a cumulative cost
Following are cost and schedule data for a project that is underway.
Using the cost data in the cost table above, create a cumulative cost curve comparing actual versus planned costs
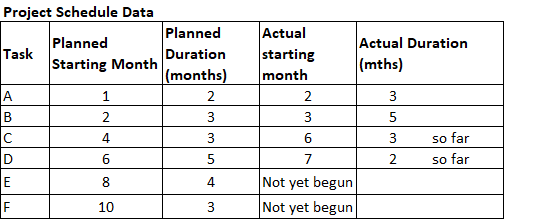
Using the schedule data in the schedule table above, create a Gantt chart comparing actual versus planned schedule performance
Summarize in words what you see project status to be at this time. What do you predict regarding the final cost and final schedule for the project?
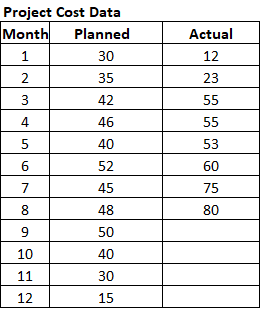
Project Cost Data Mont Actual 12 23 Planned 30 35 42 46 40 52 45 48 50 40 30 15 2 4 53 60 75 6 9 10 12
Step by Step Solution
There are 3 Steps involved in it
1 Expert Approved Answer
Step: 1 Unlock

Question Has Been Solved by an Expert!
Get step-by-step solutions from verified subject matter experts
Step: 2 Unlock
Step: 3 Unlock