

Question: Following are financial data for Syke and Under Shield. $ millions Net income Net sales Syke Under Shield 1 Year prior Current Year $
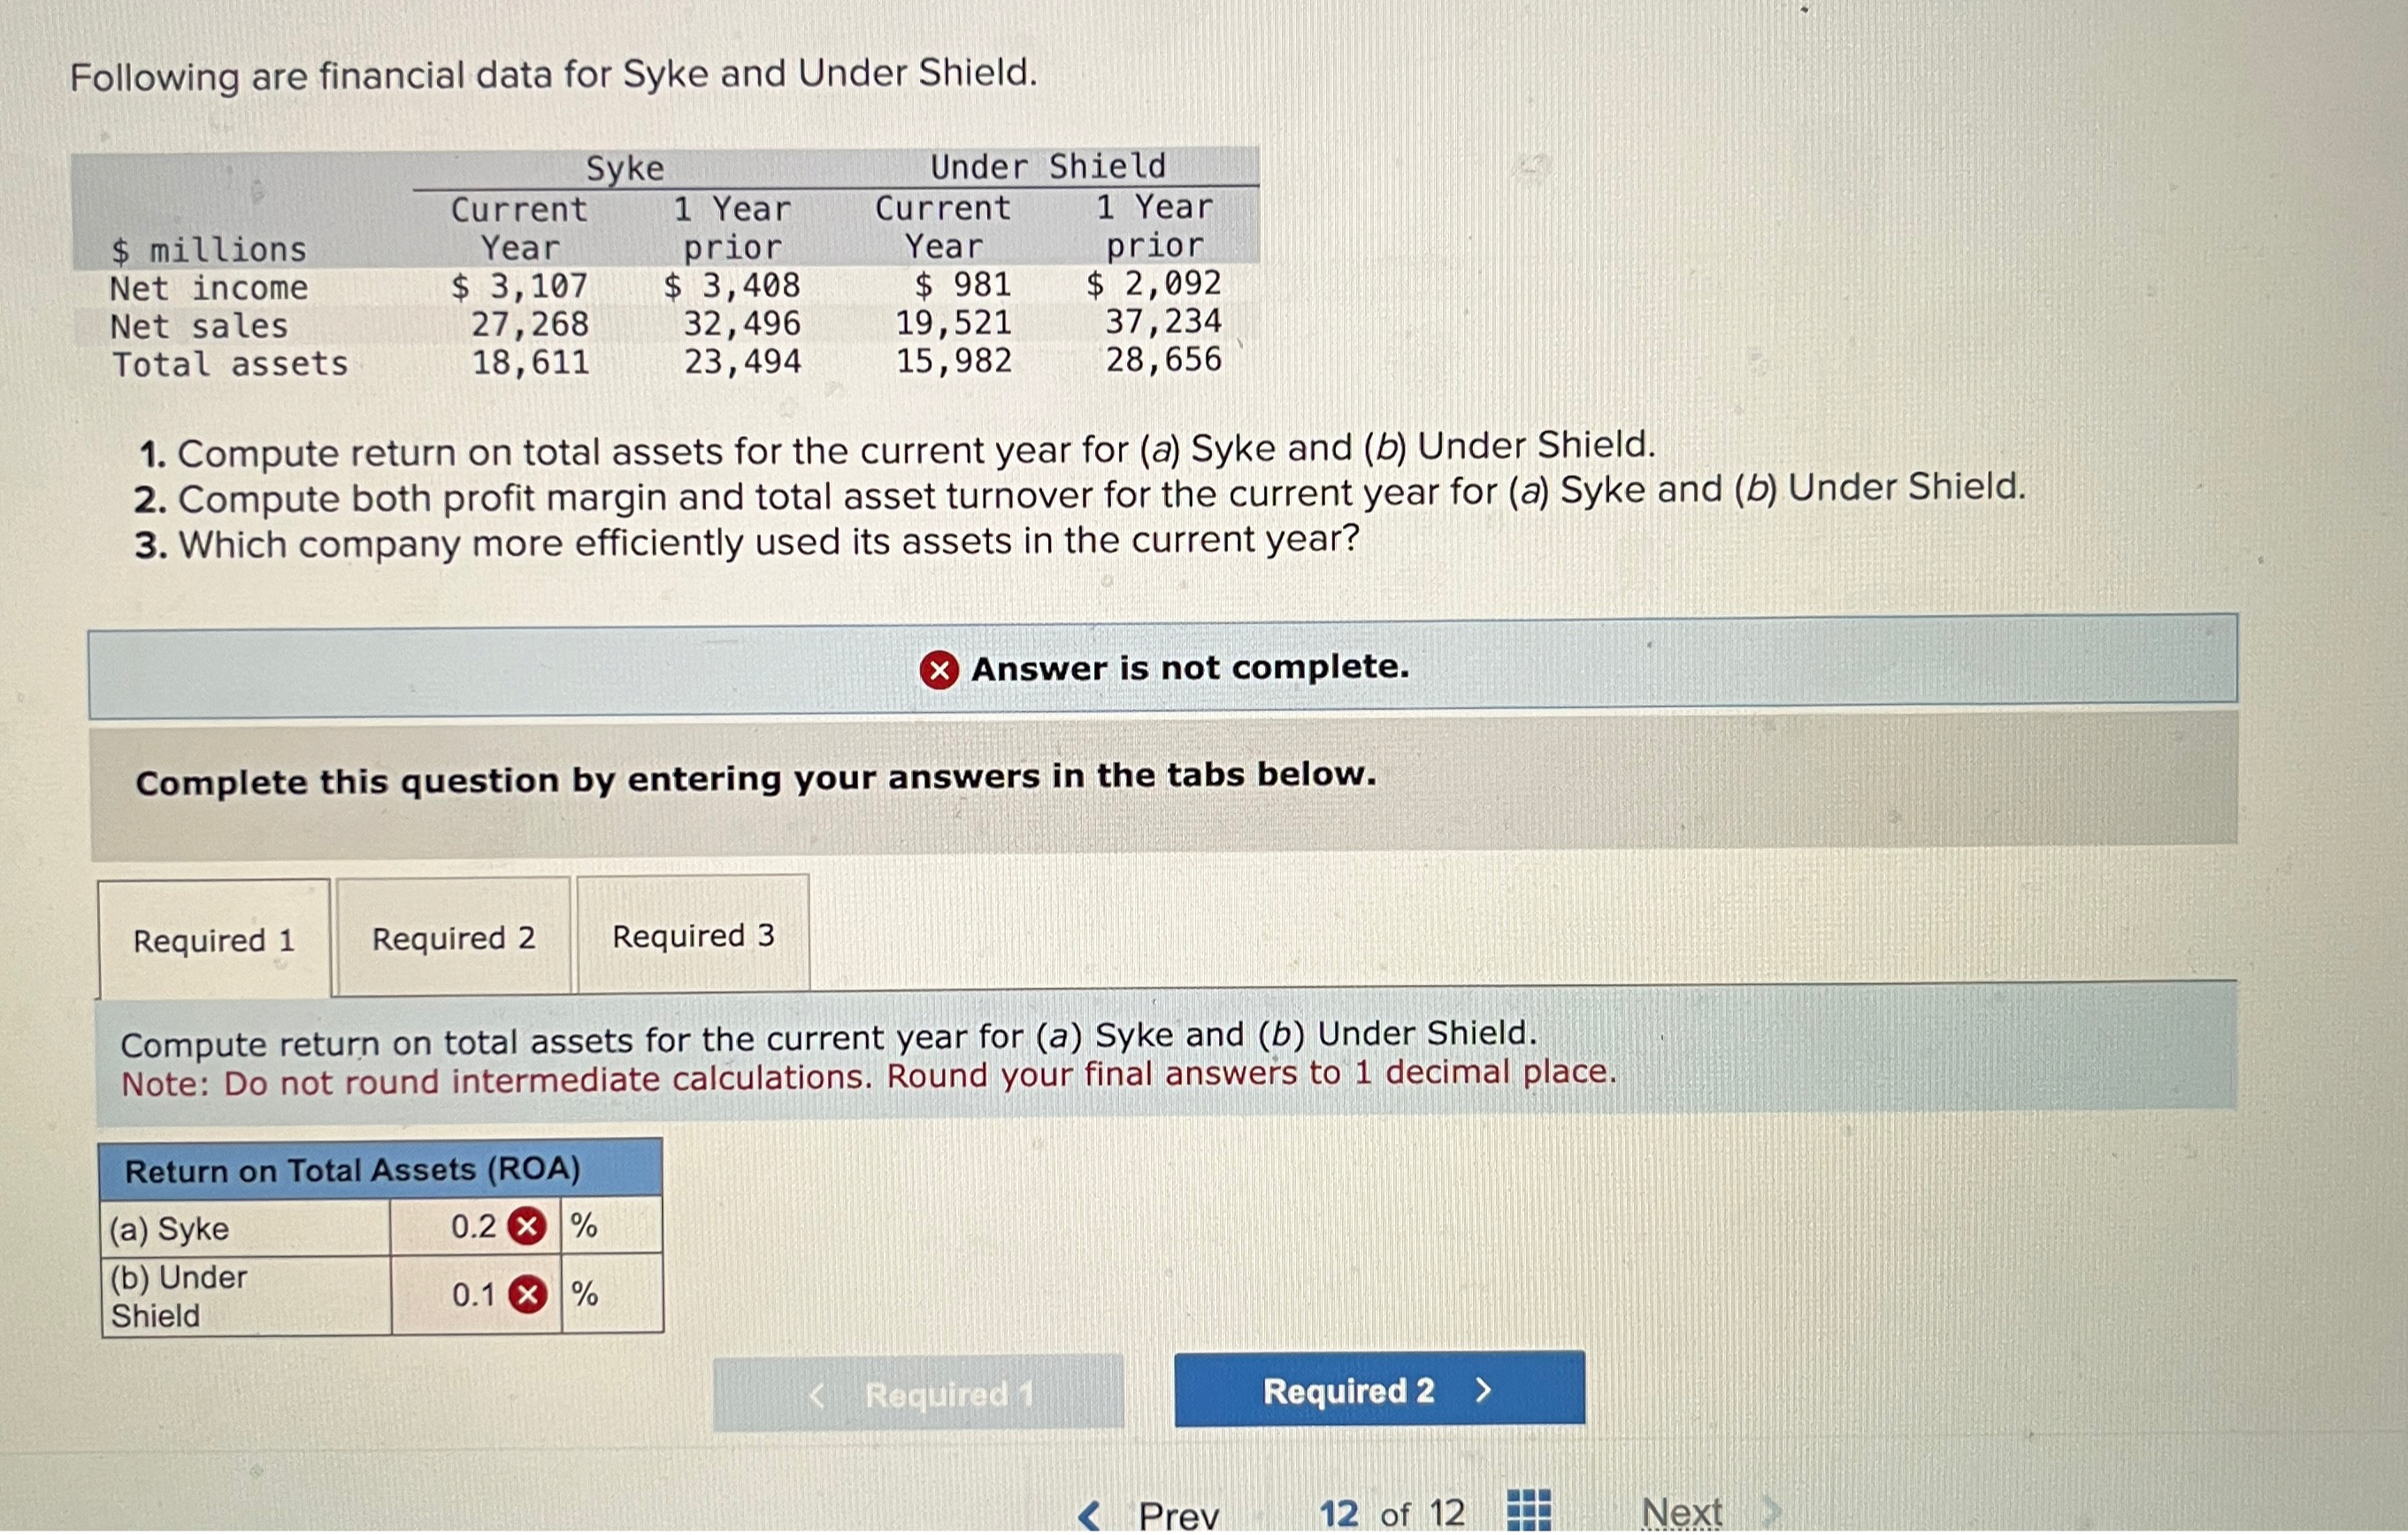
Following are financial data for Syke and Under Shield. $ millions Net income Net sales Syke Under Shield 1 Year prior Current Year $ 3,107 27,268 Total assets 18,611 1 Year prior $ 3,408 32,496 23,494 Current Year $ 981 19,521 15,982 $ 2,092 37,234 28,656 1. Compute return on total assets for the current year for (a) Syke and (b) Under Shield. 2. Compute both profit margin and total asset turnover for the current year for (a) Syke and (b) Under Shield. 3. Which company more efficiently used its assets in the current year? Answer is not complete. Complete this question by entering your answers in the tabs below. Required 1 Required 2 Required 3 Compute return on total assets for the current year for (a) Syke and (b) Under Shield. Note: Do not round intermediate calculations. Round your final answers to 1 decimal place. Return on Total Assets (ROA) (a) Syke (b) Under Shield 0.2% 0.1 % < Required 1 Required 2 > < Prev 12 of 12 Next>
Step by Step Solution
There are 3 Steps involved in it

Get step-by-step solutions from verified subject matter experts