

Question: Following are the data on demand for white bread loaves at a bakery. Day Loaves 210 211 214 231 234 DO VOVIAWNA 236 244 256
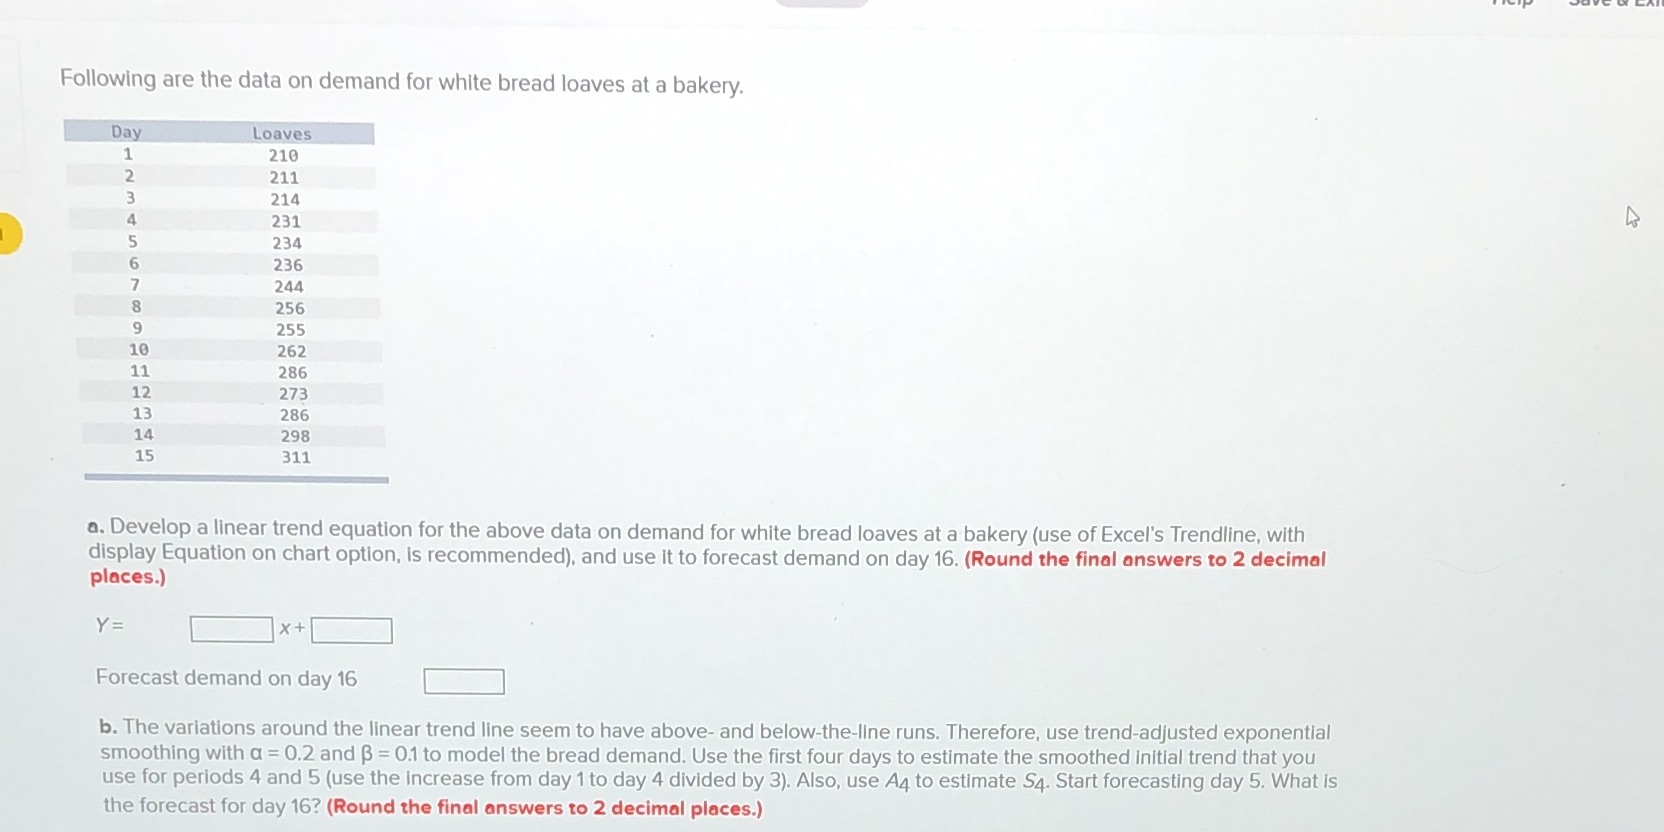
Following are the data on demand for white bread loaves at a bakery. Day Loaves 210 211 214 231 234 DO VOVIAWNA 236 244 256 255 262 11 286 12 273 13 286 14 298 15 311 a. Develop a linear trend equation for the above data on demand for white bread loaves at a bakery (use of Excel's Trendline, with display Equation on chart option, is recommended), and use it to forecast demand on day 16. (Round the final answers to 2 decimal places.) Y = x + Forecast demand on day 16 b. The variations around the linear trend line seem to have above- and below-the-line runs. Therefore, use trend-adjusted exponential smoothing with a = 0.2 and B = 0.1 to model the bread demand. Use the first four days to estimate the smoothed initial trend that you use for periods 4 and 5 (use the increase from day 1 to day 4 divided by 3). Also, use A4 to estimate S4. Start forecasting day 5. What is the forecast for day 16? (Round the final answers to 2 decimal places.)
Step by Step Solution
There are 3 Steps involved in it

Get step-by-step solutions from verified subject matter experts