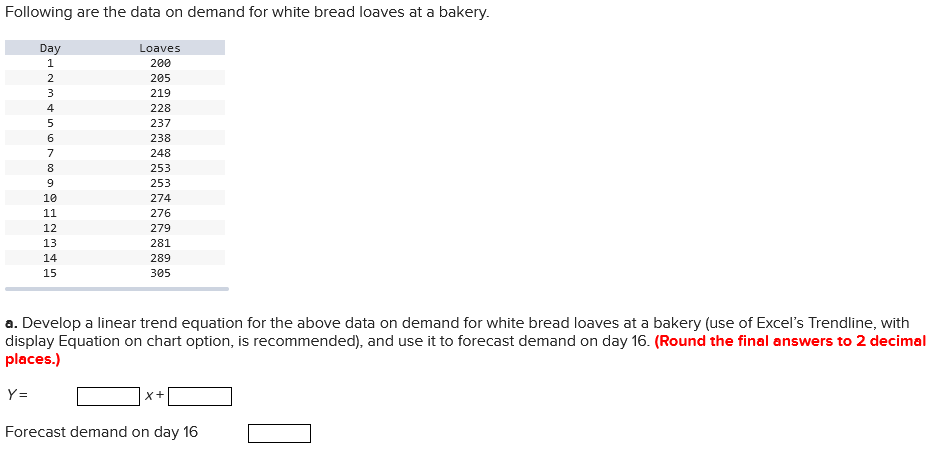
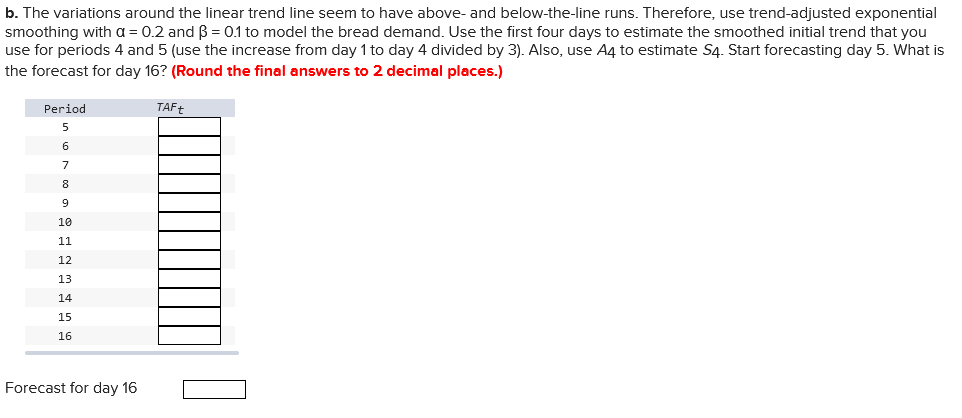
Question: Following are the data on demand for white bread loaves at a bakery. a. Develop a linear trend equation for the above data on demand

Following are the data on demand for white bread

Following are the data on demand for white bread

Following are the data on demand for white bread loaves at a bakery. a. Develop a linear trend equation for the above data on demand for white bread loaves at a bakery (use of Excel's Trendline, with display Equation on chart option, is recommended), and use it to forecast demand on day 16 . (Round the final answers to 2 decimal places.) Y=x+ b. The variations around the linear trend line seem to have above- and below-the-line runs. Therefore, use trend-adjusted exponential smoothing with =0.2 and =0.1 to model the bread demand. Use the first four days to estimate the smoothed initial trend that you use for periods 4 and 5 (use the increase from day 1 to day 4 divided by 3 ). Also, use A4 to estimate S4. Start forecasting day 5 . What is the forecast for day 16 ? (Round the final answers to 2 decimal places.) Forecast for day 16

Step by Step Solution

There are 3 Steps involved in it

1 Expert Approved Answer
Step: 1 Unlock blur-text-image
Question Has Been Solved by an Expert!

Get step-by-step solutions from verified subject matter experts

Step: 2 Unlock
Step: 3 Unlock

Students Have Also Explored These Related General Management Questions!