

Question: Following are the results from two different simple regression analyses, estimating the costs of the purchasing department using number of purchase orders and number of
Following are the results from two different simple regression analyses, estimating the costs of the purchasing department using number of purchase orders and number of vendors as potential cost drivers.
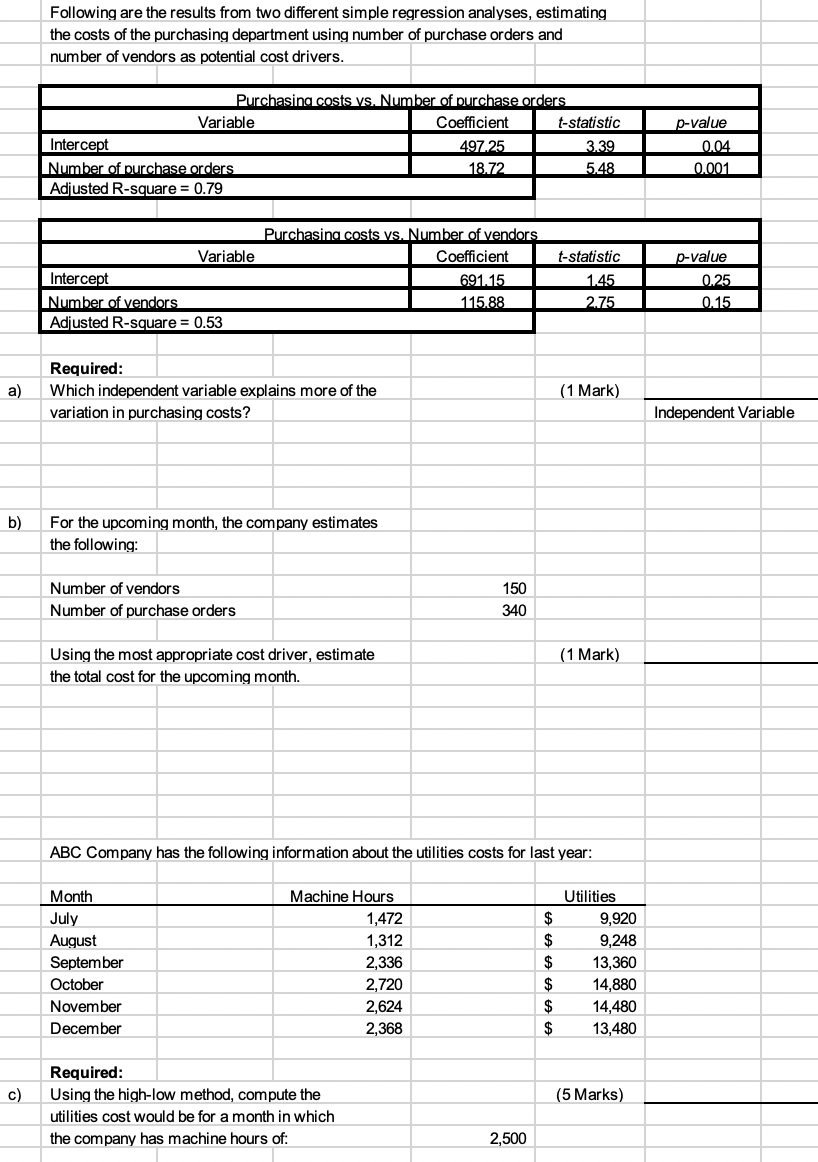
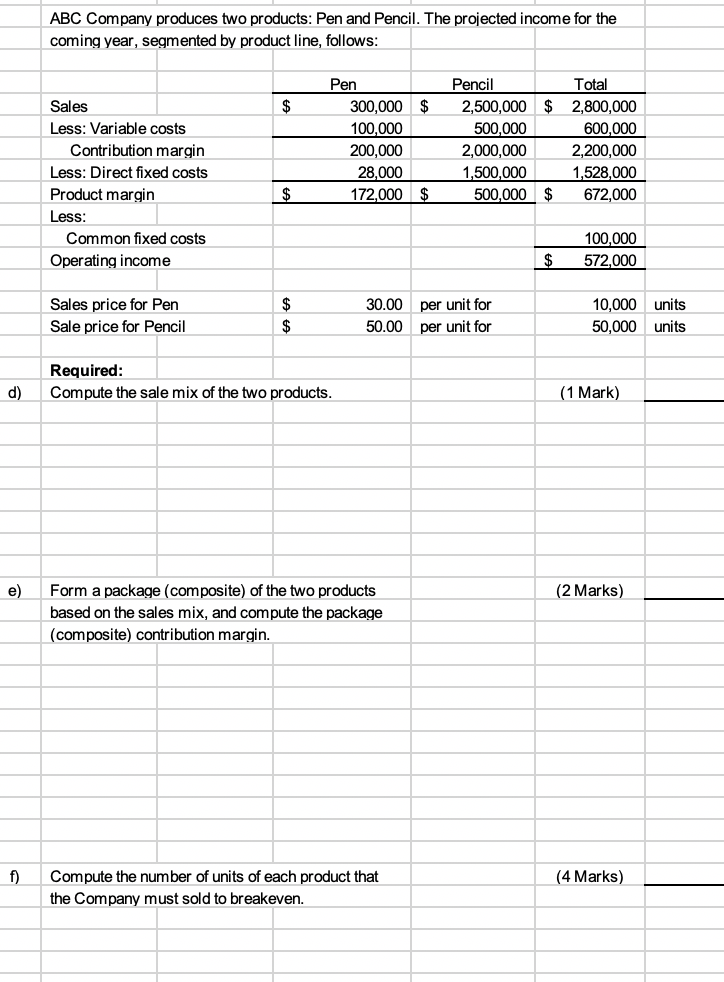
Following are the results from two different simple regression analyses, estimating the costs of the purchasing department using number of purchase orders and number of vendors as potential cost drivers. Purchasing costs vs. Number of purchase orders Variable Coefficient t-statistic p-value Intercept 197.25 3.39 0.04 Number of purchase orders 18.72 5.48 0.001 Adjusted R-square = 0.79 Purchasing costs vs. Number of vendors Variable Coefficient t-statistic p-value Intercept 591.15 1.45 2.25 Number of vendors 115.88 2.75 0.15 Adjusted R-square = 0.53 Required: a) Which independent variable explains more of the (1 Mark) variation in purchasing costs? Independent Variable b ) For the upcoming month, the company estimates the following: Number of vendors 150 Number of purchase orders 340 Using the most appropriate cost driver, estimate (1 Mark) the total cost for the upcoming month. ABC Company has the following information about the utilities costs for last year: Month Machine Hours Utilities July 1,472 9,920 August 1,312 9,248 September 2,336 13,360 October 2,720 14,880 November 2,624 14,480 December 2,368 13,480 Required: c) Using the high-low method, compute the (5 Marks) utilities cost would be for a month in which the company has machine hours of: 2,500ABC Company produces two products: Pen and Pencil. The projected income for the coming year, segmented by product line, follows: Pen Pencil Total Sales $ 300,000 $ 2,500,000 $ 2,800,000 Less: Variable costs 100,000 500,000 600,000 Contribution margin 200,000 2,000,000 2,200,000 Less: Direct fixed costs 28,000 1,500,000 1,528,000 Product margin $ 172,000 $ 500,000 672,000 Less: Common fixed costs 100,000 Operating income $ 572,000 Sales price for Pen 30.00 per unit for 10,000 units Sale price for Pencil $ 50.00 per unit for 50,000 units Required: d) Compute the sale mix of the two products. (1 Mark) e) Form a package (composite) of the two products (2 Marks) based on the sales mix, and compute the package (composite) contribution margin. f) Compute the number of units of each product that (4 Marks) the Company must sold to breakeven
Step by Step Solution
There are 3 Steps involved in it

Get step-by-step solutions from verified subject matter experts