

Question: Following split stem and leaf plot represents the age of students enrolled in a master's program at a university. [4 marks] Stem Leaves 2
![in a master's program at a university. [4 marks] Stem Leaves 2](https://dsd5zvtm8ll6.cloudfront.net/si.experts.images/questions/2023/02/63ec96458c7d6_1676449348473.png)
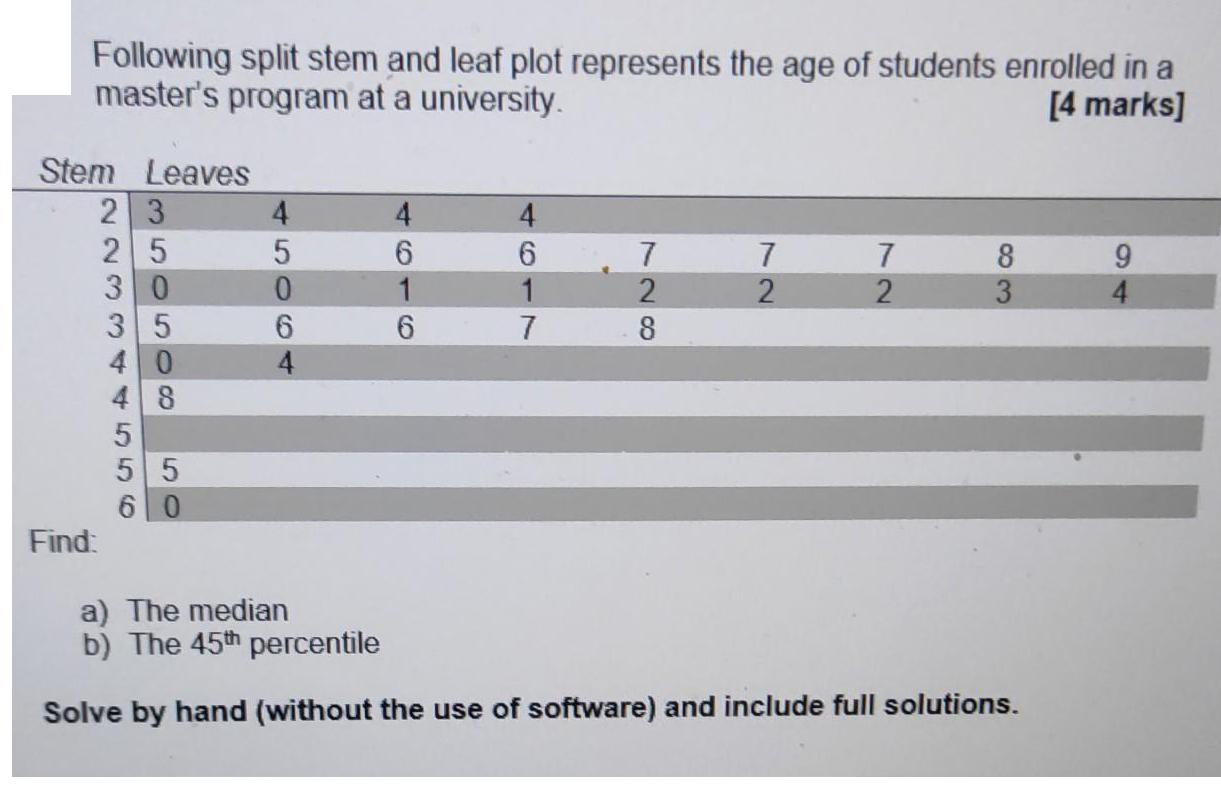
Following split stem and leaf plot represents the age of students enrolled in a master's program at a university. [4 marks] Stem Leaves 2 3 25 30 35 40 48 Find: 5 5 5 60 4 5 0 6 4 4 6 1 6 4 6 1 7 728 8 7 2 7 2 83 a) The median b) The 45th percentile Solve by hand (without the use of software) and include full solutions. 9 4 The following data represents the heights (in inches) of kids starting junior kindergarten at a school in September 2022 35.7, 37.0, 32.7, 41.6, 32.3, 38.5, 37.4, 38.8, 23.8, 34.9 a) What is the interquartile range? [3 marks] b) Are there any mild or extreme outliers in the data? Perform all necessary calculations to justify your answer. Use the method involving the interquartile range to identify the outliers. [3 marks] Solve by hand (without the use of software) and include full solutions.
Step by Step Solution
3.46 Rating (149 Votes )
There are 3 Steps involved in it
811 data ane 23 24 24 24 25 25 26 26 27 27 27 28 29 30 30 31 31 ... View full answer

Get step-by-step solutions from verified subject matter experts