

Question: Following tables are created in order to generate forecasts using weighted moving average and simple moving average for the sales amount of a certain
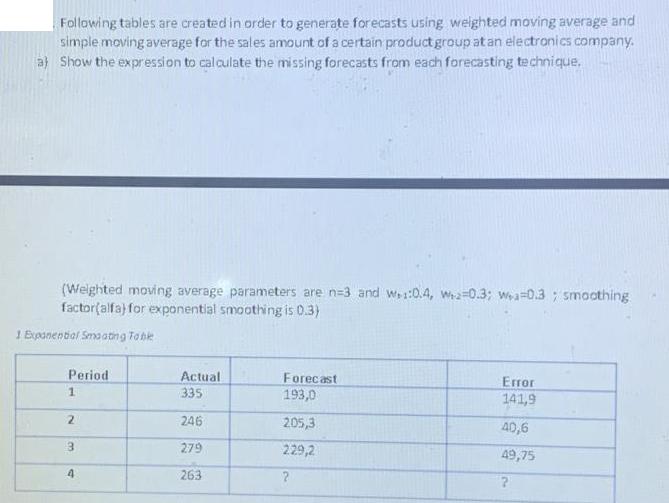
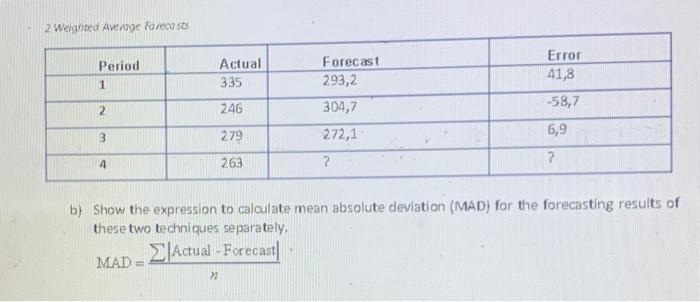
Following tables are created in order to generate forecasts using weighted moving average and simple moving average for the sales amount of a certain product group at an electronics company. a) Show the expression to calculate the missing forecasts from each forecasting technique. (Weighted moving average parameters are n-3 and w1:0.4, Wa=0.3; wa=0.3; smoothing factor(alfa) for exponential smoothing is 0.3) 1 Exponential Smaating Table Period 1 2 3 4 Actual 335 246 279 263 Forecast 193,0 205,3 229,2 Error 141,9 40,6 49,75 ? 2 Weighted Average Forecasts Period 1 2 3 4 MAD = Actual 335 246 279 263 Actual-Forecast 22 Forecast 293,2 304,7 272,1 b) Show the expression to calculate mean absolute deviation (MAD) for the forecasting results of these two techniques separately. ? Error 41,8 -58,7 6,9 7
Step by Step Solution
There are 3 Steps involved in it
The image shows two tables that are related to the sales amount forecasts using weighted moving average and exponential smoothing for a certain produc... View full answer

Get step-by-step solutions from verified subject matter experts